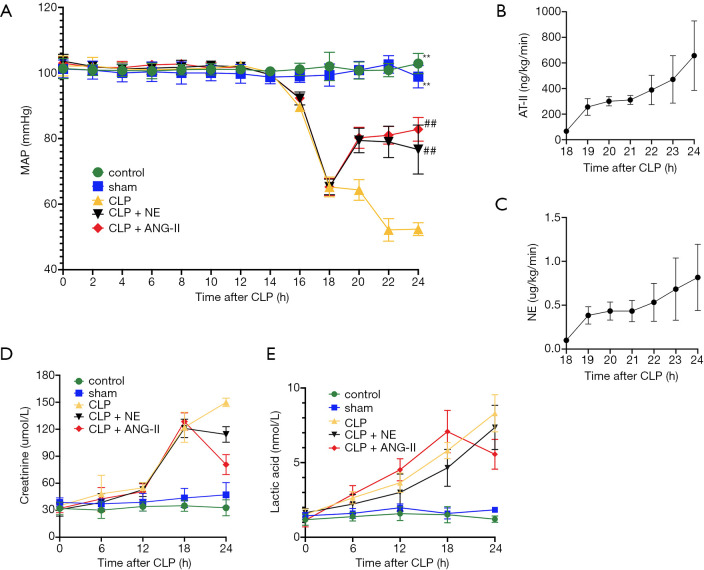
Figure 2.
The effects of ANG II and NE on the MAPs and biochemical parameters in rats. (A) The MAPs were recorded every 2 hours after the experiment start; (B,C) doses of ANG II and NE were recorded every hour after treatment; (D,E) serum levels of creatinine and lactic acid were measured every 6 h after the experiment start. The Lac concentration of CLP group increased continuously at 24 h after the CLP procedure (P=0.004 vs. 18 h after procedure). The After administration of ANG II, Lac concentration decreased at 24 h after CLP procedure (P=0.005 vs. CLP group), but the effect was not the same in the CLP + NE group (P=1.000 vs. CLP group). Data are expressed as mean ± SEM. CLP; n=8 in the control or sham, n=5 in CLP, n=6 in CLP + ANG II, n=6 in CLP + NE. **, at the 24 h after procedure, compare with the CLP group, P<0.01; ##, at the 24 h after procedure, compare with the CLP group, P<0.05.

