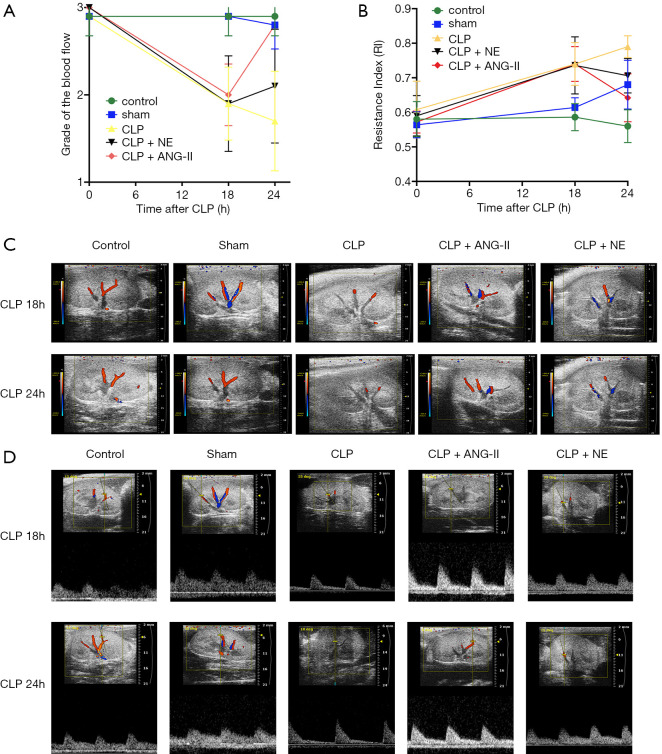
Figure 3.
Effects of ANG II and NE on renal blood flow and the renal RI. The renal blood flow (A and C) and RI (B and D) of each rat were measured 18 and 24 h after the start of the experiment. Representative ultrasound images are shown. Data are expressed as the mean ± SEM. n=8 in the control or sham, n=5 in CLP, n=6 in CLP + ANG II, n=6 in CLP + NE.

