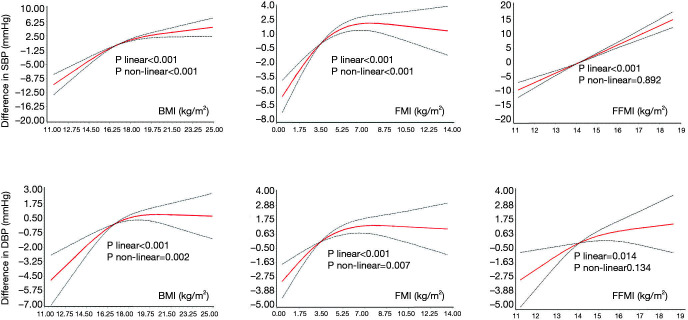
Figure 1.
The restricted cubic spline for the association between body composition indexes (measured by BMI, FMI and FFMI) and difference in blood pressure (SBP and DBP). The lines represent adjusted difference based on restricted cubic splines for the level of body composition in multi-variable linear and non-linear regression models. Adjusted factors were age, sex and residential areas. BMI, body mass index, kg/m2; FMI, fat mass index, kg/m2; FFMI, fat free mass index, kg/m2; SBP, systolic blood pressure, mmHg; DBP, diastolic blood pressure, mmHg. The solid lines represent the predicted value, and the dash lines were their 95% confidence interval.

