
Figure 1.
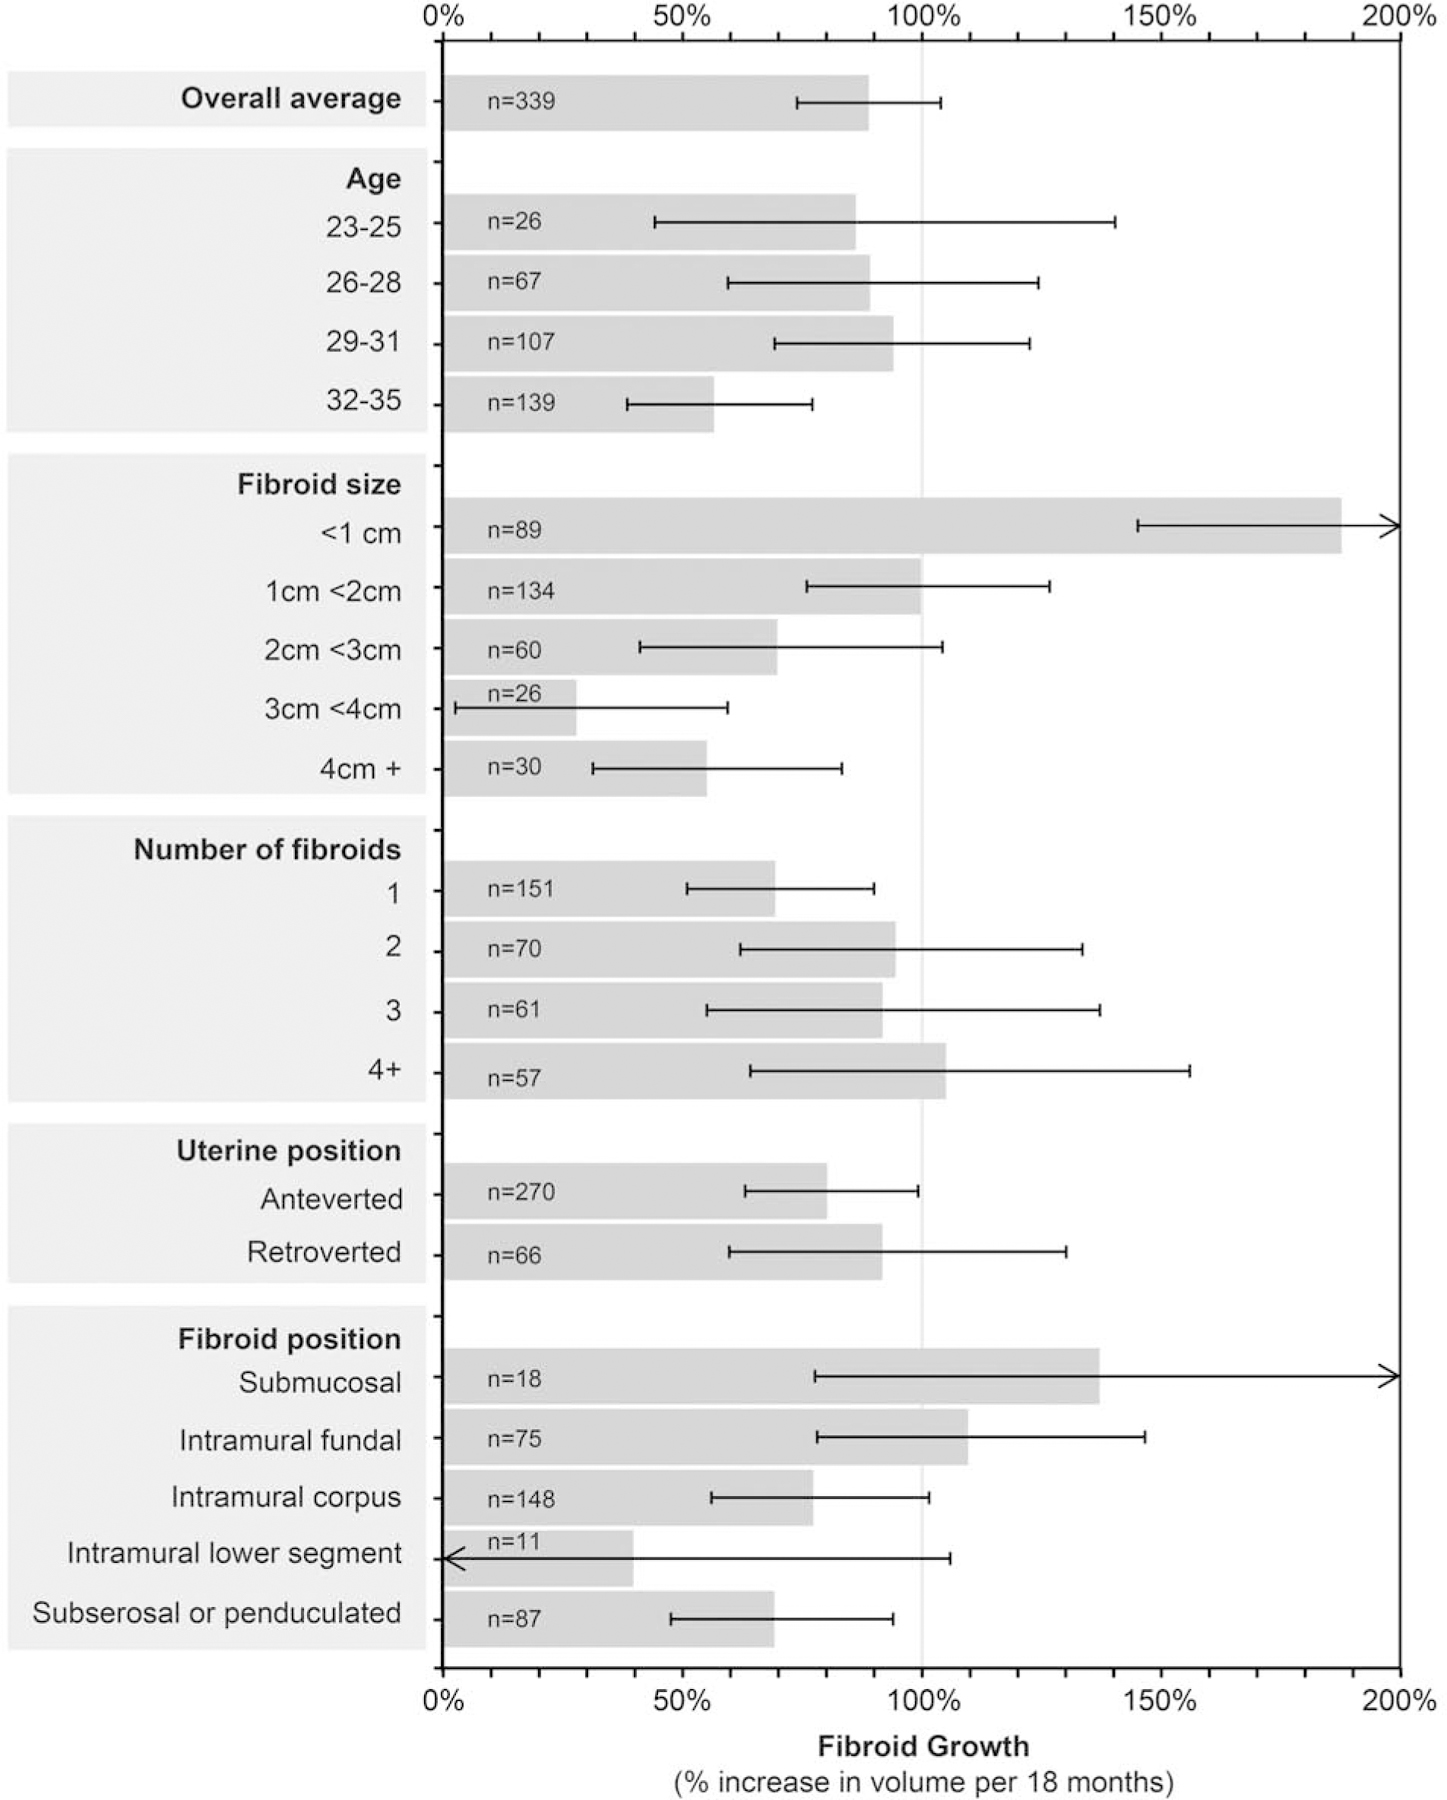
Variation in fibroid growth by woman and fibroid characteristics
Fibroid growth per 18 months associated with categories of baseline characteristics (n = 339 fibroids after excluding 5 outliers). Horizontal lines show 95% CIs. Estimates are adjusted for baseline age and fibroid size and are based on converting model results (change in ln-volume over time) to percent change in volume indexed to 18 months. There was no interaction between age and fibroid size (p=0.70).