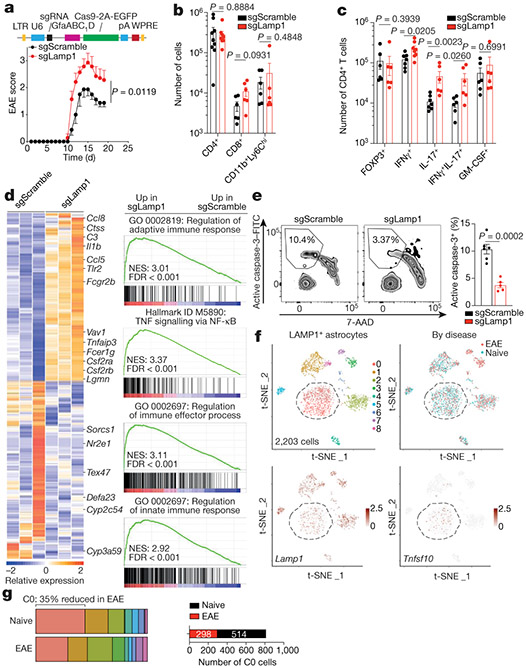
Fig. 2 ∣. LAMP1+ astrocytes limit CNS inflammation and express TRAIL.
a, Top, schematic of lentivirus vector. Bottom, EAE curves in mice treated with sgRNA against Lamp1 (sgLamp1) or control scramble sgRNA (sgScramble) (n = 19 sgScramble; n = 15 sgLamp1 mice). Experiment repeated three times. Two-way repeated measures analysis of variance (ANOVA). b, Quantification of immune cells in sgScramble- or sgLamp1-transduced mice (n = 9 sgScramble CD4+; n = 8 sgLamp1 CD4+; n = 6 mice otherwise). Two-tailed Mann–Whitney test. c, Quantification of the CD4+ T cell subset in sgScramble- or sgLamp1-transduced mice (n = 8 IFNγ+; n = 7 sgScramble IFNγ+IL-17+; n = 6 mice otherwise). Two-tailed Mann–Whitney test. d, Left, differential gene expression determined by bulk RNA-seq in sgScramble- or sgLamp1-transduced mice. Right, gene set enrichment analysis (GSEA) comparing sgScramble- and sgLamp1-transduced mice (day 19 after EAE induction; n = 3 mice per group). Gene Ontology (GO) terms are shown. FDR, false discovery rate; NES, normalized enrichment score. e, FACS analysis of activation of caspase-3 in CNS CD4+ T cells (n = 6 sgScramble; n = 5 sgLamp1 mice). Unpaired two-tailed t-test. f, Top, t-distributed stochastic neighbour embedding (t-SNE) plots of LAMP1+ astrocytes from naive or EAE Aldh1l1creERT2tdTomato mice (day 17 after EAE induction; n = 3 mice per group) analysed by scRNA-seq. Bottom, t-SNE plots of Lamp1 and Tnfsf10. g, Left, distribution of scRNA-seq clusters by condition. Right, number of cluster 0 (C0) cells (n = 812 cells). Data are mean ± s.e.m. (a–c, e).

