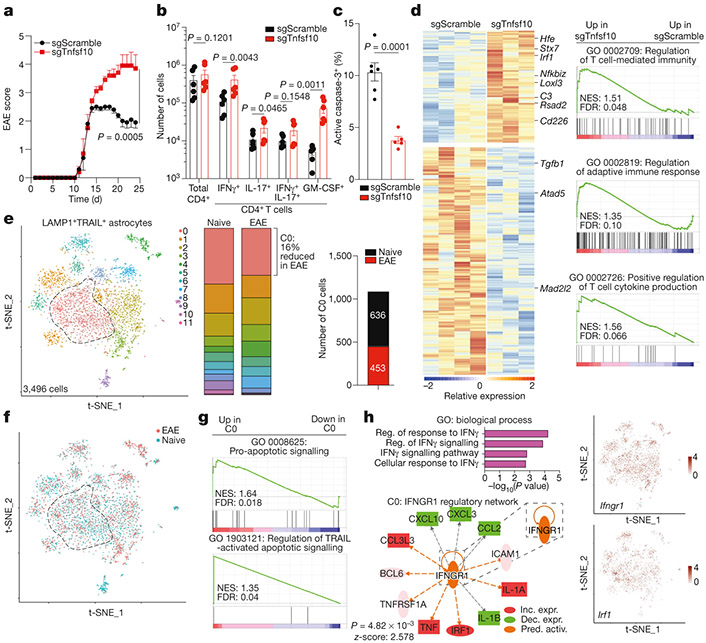
Fig. 3 ∣. TRAIL+ astrocytes limit EAE development.
a, EAE curves in sgScramble (n = 24) and sgTnfsf10 (n = 25) mice. Experiment repeated three times. Two-way repeated measures ANOVA. b, Quantification of T cell subsets (day 24 after EAE induction; n = 6 mice per group). One-tailed Mann–Whitney test. c, Activation of caspase-3 in CNS CD4+ T cells (n = 6 sgScramble; n = 5 sgTnfsf10 mice). Unpaired two-tailed t-test. d, Left, differential gene expression determined by bulk RNA-seq in astrocytes isolated from sgScramble (n = 4) or sgTnfsf10 (n = 3)-transduced mice (left) at 24 days after EAE induction. Right, GSEA comparing sgScramble- and sgTnfsf10-transduced mice. e, f, Left, t-SNE plots of LAMP1+TRAIL+ astrocytes from naive or EAE Aldh1l1creERT2tdTomato mice (day 17 after EAE induction; n = 3 mice per group) analysed by scRNA-seq. e, Right, number of cluster 0 cells (n = 1,089 cells). g, GSEA of C0 astrocytes. h, Top left, GO analysis of differentially upregulated pathways in C0 astrocytes. Reg., regulation. Bottom left, predicted upstream regulation of the C0 transcriptional signature using Ingenuity Pathway Analysis (Qiagen). Inc. expr., increased expression; dec. expr., decreased expression; pred. activ., predicted activation. Right, t-SNE plots of Ifngr1 and Irf1. Data are mean ± s.e.m. (a–c).

