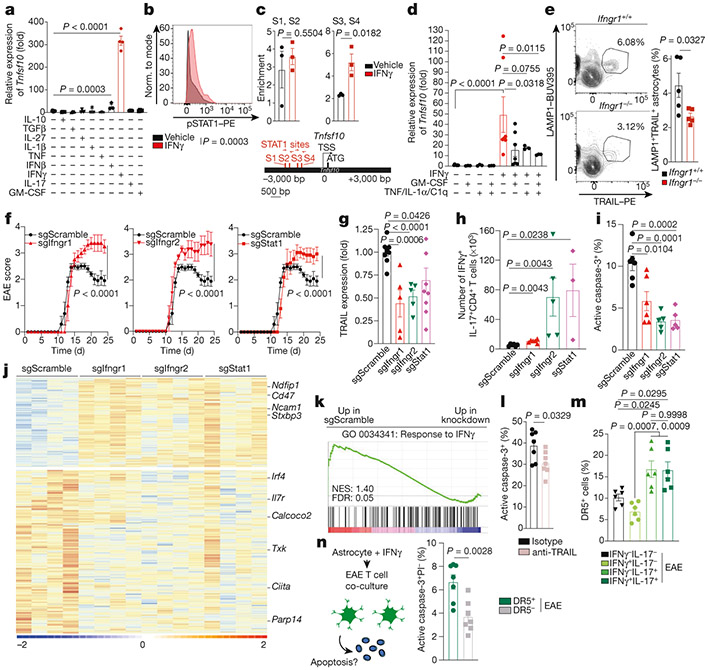
Fig. 4 ∣. IFNγ induces TRAIL expression in astrocytes.
a, Quantitative PCR (qPCR) of Tnfsf10 expression in mouse primary astrocytes (n = 11 vehicle; n = 3 IL-1β; n = 3 TNF; n = 3 IFNβ; n = 4 biological replicates otherwise). Unpaired two-tailed t-test. b, Levels of pSTAT1 in mouse primary astrocytes after 60-min treatment with IFNγ or vehicle (n = 4 biological replicates per condition). Experiment repeated three times. Unpaired two-tailed t-test. c, Bottom, STAT1-binding motifs (STAT1 sites 1–4; S1–S4) in the Tnfsf10 promoter. Top, STAT1 chromatin immunoprecipitation (ChIP)-qPCR after IFNγ or vehicle treatment. n = 3 per condition. Unpaired two-tailed t-test. d, qPCR of Tnfsf10 expression in mouse primary astrocytes (n = 7 vehicle, IFNγ, IFNγ + GM-CSF; n = 3 mice otherwise). Welch’s two-tailed t-test, In-normalized data. e, FACS analysis of LAMP1+TRAIL+ astrocytes (day 28 after EAE induction; n = 5 per group). Unpaired two-tailed t-test. f, EAE curves (n = 24 sgScramble; n = 18 sgIfngr1; n = 14 sgIfngr2; n = 12 sgStat1 mice). Experiment repeated three times. Two-way repeated measures ANOVA. g, TRAIL expression in astrocytes of knockdown mice (n = 9 sgScramble; n = 5 sgIfngr1; n = 5 sgIfngr2; n = 9 sgStat1 mice). Unpaired two-tailed t-test. h, FACS analysis of CNS IFNγ+IL-17+CD4+ T cells in knockdown mice (n = 6 sgScramble, n = 6 sgIfngr1, n = 5 sgIfngr2, n = 3 sgStat1 mice). Two-tailed Mann–Whitney test. i, Activation of caspase-3 in CNS CD4+T cells (n = 6 sgScramble, sgIfngr1; n = 5 mice otherwise). Unpaired two-tailed t-test. j, k, Heat map (j) and GSEA (k) of astrocyte gene expression (day 24 after EAE induction; n = 4 mice per group). l, Activation of caspase-3 in CD4+T cells co-cultured with astrocytes and anti-TRAIL blocking antibody (n = 7 biological replicates) per condition. Unpaired two-tailed t-test. m, Expression of DR5 in CD4+ T cells in peak EAE mice (day 18 after EAE induction; n = 6 mice per group). One-way ANOVA, Tukey’s post-hoc test. n, Schematic (left) and quantification (right) of active caspase-3 expression in DR5+ and DR5− CD4+ T cells isolated from peak EAE mice (day 18 after EAE induction), co-cultured with IFNγ-pre-treated astrocytes (n = 7 biological replicates per group) PI, propidium iodide. Unpaired two-tailed t-test. Data are mean ± s.e.m. (a, c, d–i, l–n).

