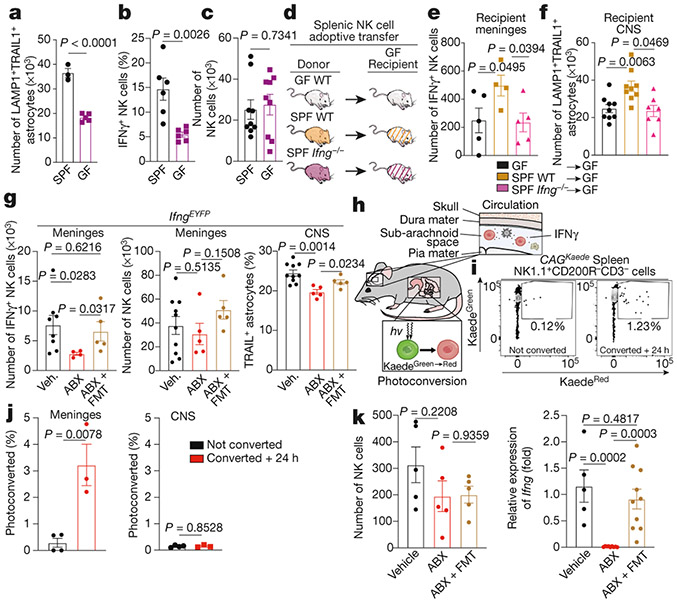
Fig. 6 ∣. The microbiome modulates LAMP1+TRAIL+ astrocytes through meningeal IFNγ+ NK cells.
a–c, FACS analysis of LAMP1+TRAIL+ astrocytes (a), meningeal IFNγ+NK (NK1.1+CD200R−) cells (b) and meningeal NK cells (c) in SPF and germ-free (GF) mice (n = 3 SPF mice; n = 5 GF mice (a); n = 6 mice per group (b); n = 9 mice per group (c)). Unpaired two-tailed t-test. d, Schematic of adoptive transfer experiment. WT, wild type. e, f, FACS analysis of meningeal IFNγ+ NK cells (e) and LAMP1+TRAIL+ astrocytes (f) in mice receiving 1 × 10⁶ NK cells (e: n = 4 SPF wild type; n = 5 mice otherwise; one-way ANOVA, Fisher’s test; f: n = 10 SPF wild type; n = 9 Ifng−/− mice; Kolmogorov–Smirnov two-tailed test). Ifng−/− data are log-normalized in f. g, FACS analysis of IFNγ+NK1.1+CD200R− cells in the meninges (left), total NK1.1+CD200R− cells in the meninges (middle) and TRAIL+ astrocytes in the CNS (right) of mice treated as indicated (left: n = 8 vehicle, n = 4 ABX, n = 5 ABX + FMT mice; middle: n = 10 vehicle, n = 5 mice otherwise; right: n = 10 vehicle, n = 5 mice otherwise). Two-tailed Mann–Whitney test (left, middle); unpaired two-tailed t-test (right). h, Schematic of Kaede photoconversion experiment. i, Representative analysis of splenic NK1.1+CD200R−CD3− cells after photoconversion in the small intestine. Conv, converted. j, Quantification of NK cells in meninges and CNS parenchyma after photoconversion in the small intestine (n = 4 mice not converted; n = 3 mice converted + 24 h). Unpaired two-tailed t-test. k, Quantification of splenic NK cells (left) and Ifng expression in splenic NK cells (right) in mice after small intestine photoconversion and indicated treatments (left: n = 5 mice per group; right: n = 5 vehicle; n = 9 ABX; n = 10 ABX + FMT mice). Unpaired two-tailed t-test. Data are mean ± s.e.m. (a–c, e–g, i–k).

