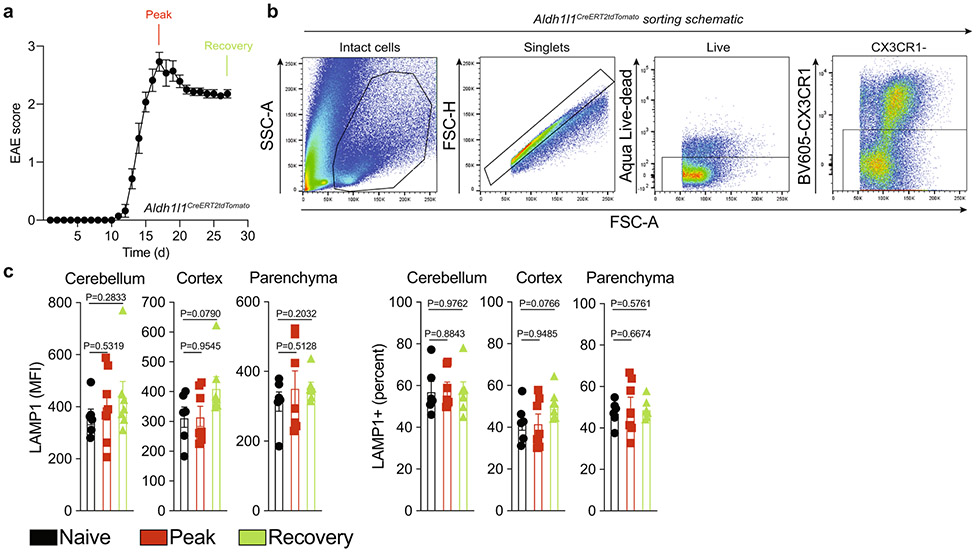
Extended Data Fig. 2∣. Analysis of differentially expressed astrocyte surface markers.
a, EAE in Aldh1l1creERT2tdTomato mice. n = 6 naive, n = 7 peak, n = 7 recovery mice. b, Sorting schematic for tdTomato+ astrocytes. c, MFI of LAMP1 expression from screening. n = 6 naive, n = 7 peak, n = 7 recovery mice. Unpaired two-tailed t-test. Data are mean ± s.e.m.

