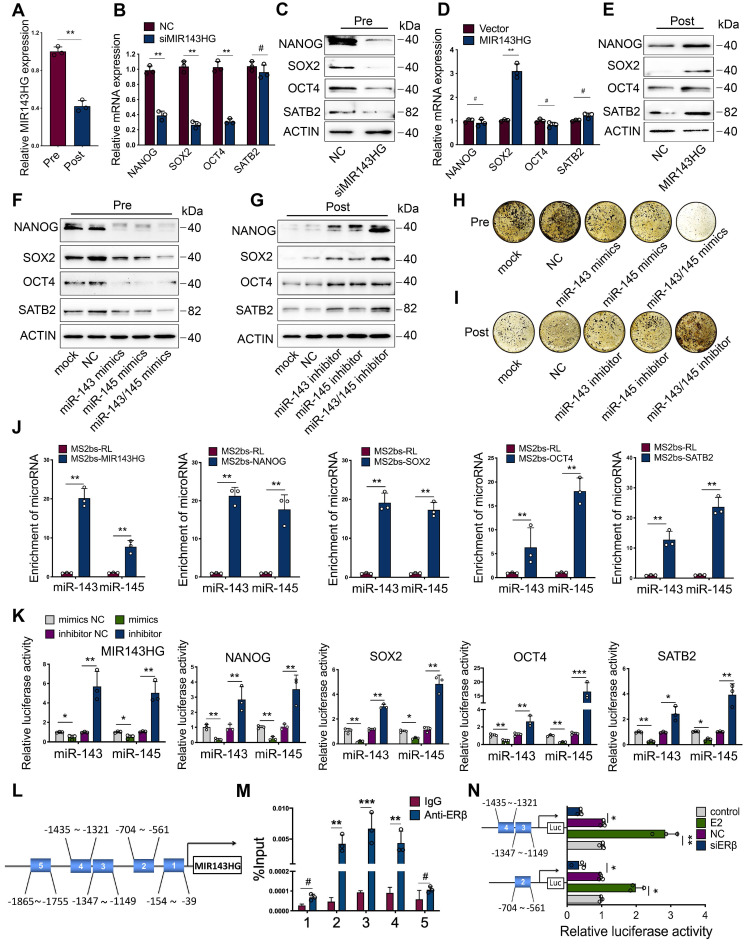
Figure 2.
ERβ activates MIR143HG transcription to regulate the function of miR-143/145 that target core TFs and SATB2. (A) qRT-PCR showing the MIR143HG expression in Pre- and Post-BMSCs. (B, C) mRNA and protein expression of NANOG, SOX2, OCT4 and SATB2 were analyzed by qRT-PCR and Western blot in BMSCs transfected with siRNA targeting MIR143HG or negative control (NC). (D, E) mRNA and protein expression were analyzed in BMSCs transduced with MIR143HG overexpressing plasmid or control vector. (F, G) Protein levels of NANOG, SOX2, OCT4 and SATB2 in Pre- and Post-BMSCs were exacerbated by miR-143/145 overexpression and rescued by miR-143/145 inhibition by Western blot analysis. (H, I) Von Kossa staining showing the calcified nodules in Pre- and Post-BMSCs transfected with miR-143/145 mimics or inhibitor. (J) The transcripts including MIR143HG, NANOG, SOX2, OCT4 and SATB2 were specifically precipitated by MS2bp-GFP and the immunoprecipitated miRNAs were subjected to qRT-PCR analysis. MS2bs-RL was calculated as controls. RL, Renilla luciferase. (K) Luciferase reporters were included as MIR143HG, NANOG, SOX2, OCT4 and SATB2, and luciferase activity in 293T cells were co-transfected with miR-143/145 mimics or inhibitor. (L, M) ChIP analysis of ERβ binding to the MIR143HG promoter using five primers as predicted and the binding sites of region 2, 3, 4 were identified. Data are presented as the relative ration of ChIP to input. (N) According to ChIP analysis, three luciferase reporters were constructed and co-transduced into 293T cells with E2 and siERβ. E2, estrogen. Results are presented as the mean ± S.D. *p < 0.05; **p < 0.01; ***p < 0.001; #p > 0.05 by Student's t test and one-way ANOVA.

