Figure 3.
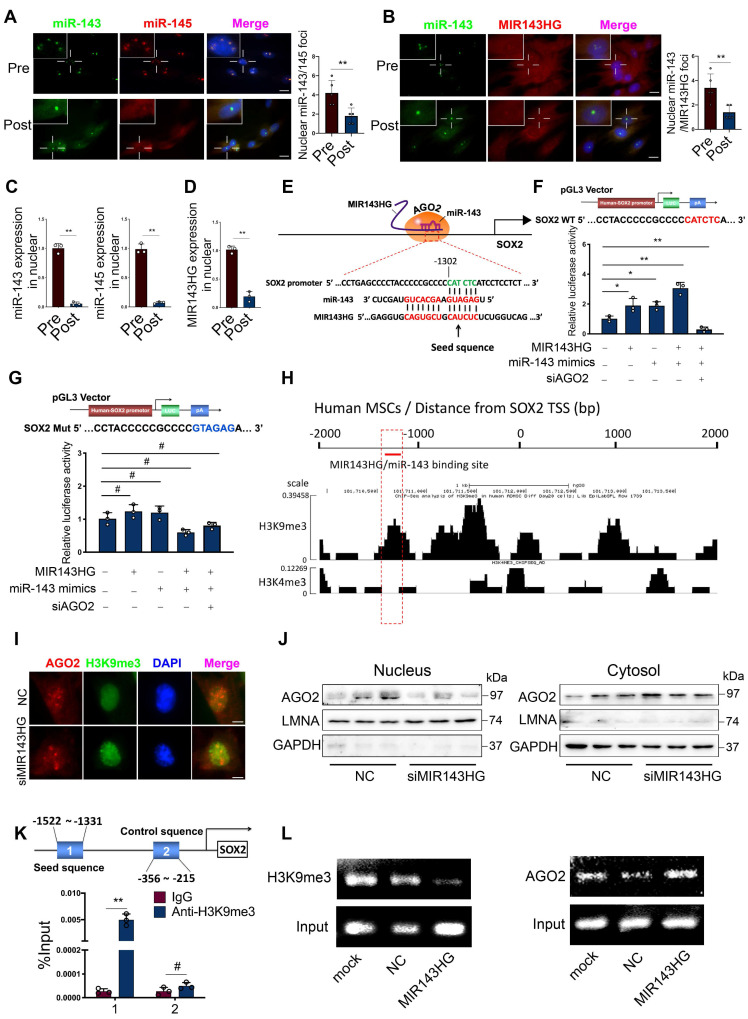
miR-143 and MIR143HG complexes shuttled into nuclei and cooperatively regulates SOX2 transcription. (A) Nuclear and cytoplasmic distribution of miR-143 and miR-145 in Pre- and Post-BMSCs as labelled by FISH assay. Scale bars: 20 μm. (B) Nuclear and cytoplasmic localization of MIR143HG and miR-143 in Pre- and Post-BMSCs. Scale bars: 20 μm. (C) qRT-PCR analysis for miR-143 and miR-145 in BMSCs nuclei. U6 was used as endogenous control. (D) qRT-PCR analysis for MIR143HG in BMSCs nuclei. GAPDH was used as endogenous control. (E) A predicted region of SOX2 promoter by sequence alignment was selected as recognition sites by MIR143HG and miR-143 complex. (F) Wild type plasmid based on predicted region of SOX2 promoter was subjected to dual-luciferase reporter assay in response to MIR143HG-overexpressing vector, miR-143 mimics and siAGO2. (G) Mutant plasmid based on the predicted region was subjected to dual-luciferase reporter assay in response to MIR143HG-overexpressing vector, miR-143 mimics and siAGO2. (H) Enrichment of H3K9me3, and H3K4me3 on the SOX2 promoter from Cistrome database. (I) After addition of siMIR143HG, AGO2 and H3K9me3 were examined by IF. Scale bars: 4 μm. (J) AGO2 isolated from nuclei and cytoplasm were detected by western blot in response to siMIR143HG treatment. (K) ChIP analysis of H3K9me3 binding to the targeted region by MIR143HG and miR-143 complex. (L) After transfected with mock, NC and MIR143HG overexpressing vector, BMSCs were subjected to ChIP assay by H3K9me3 or AGO2 antibody. The precipitated and amplified DNA were performed to gel shift assay. Input DNA were conducted as a control. Results are presented as the mean ± S.D. *p < 0.05; **p < 0.01; #p > 0.05 by Student's t test and one-way ANOVA.

