Figure 4.
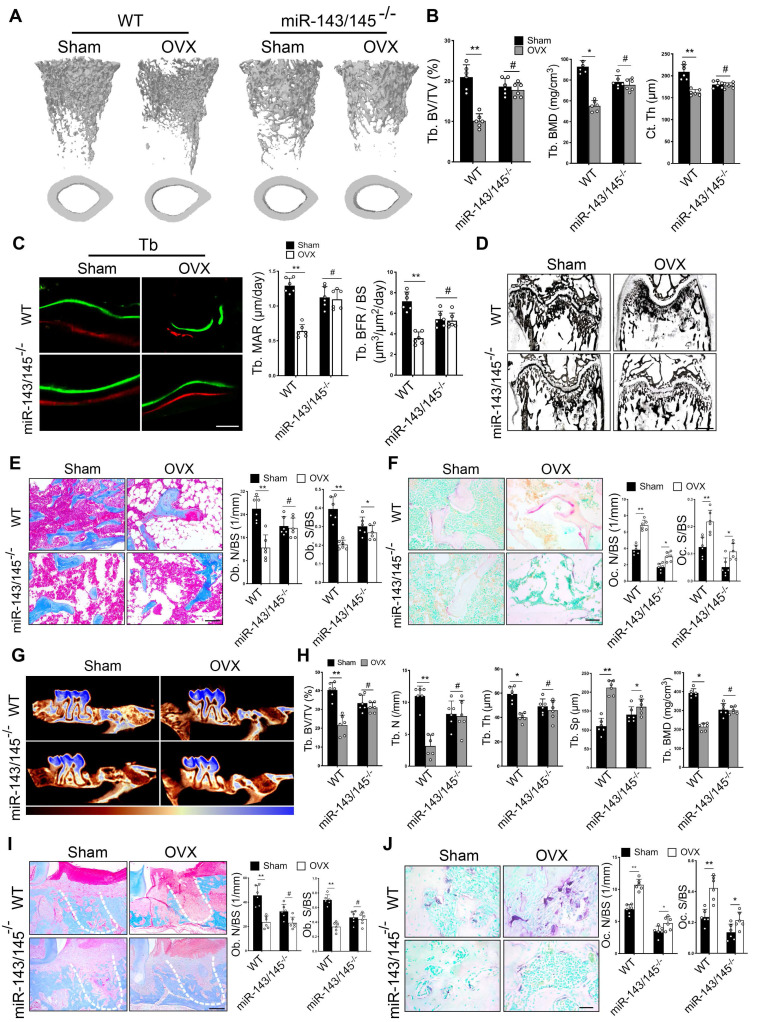
Depletion of miR-143/145 in mice prevents bone loss and maintains bone regeneration in OVX-induced osteoporosis. (A) Micro-CT analysis of trabecular and cortical bone in WT and miR-143/145-/- mice following OVX. (B) Quantitative measurements of Tb. BV/TV, Tb. BMD and Ct. Th. (C) Representative images of dynamic histomorphometry of trabecular bone (Tb) with quantification of mineralization apposition rate (MAR) and bone formation rate per bone surface (BFR/BS). Scale bars: 20 μm. (D) Representative Von Kossa staining showing an overall trabecular bone mass of WT and miR-143/145-/- mice following Sham and OVX operation. Scale bars: 500 μm. (E) Representative masson trichrome staining showing trabecular bone accounts and quantification of osteoblast numbers and surface on the trabecular. Scale bars: 100 μm. (F) Representative TRAP staining showing osteoclastic activity and quantification of osteoclast numbers and surface on the trabecular. Scale bars: 50 μm. (G) Micro-CT analysis of new bone fill in tooth extraction socket by color coded thickness maps. Color changes from red to blue denote a gradual elevation in bone thickness. (H) Quantitative measurements of Tb. BV/TV, Tb. N, Tb. Sp, Tb. Th, and Tb. BMD for new bone in extraction socket. (I) Representative masson trichrome staining showing the new bone mass and osteoblast numbers and surface on the trabecular in tooth extraction socket, which was delineated by white dotted lines. Scale bars: 100 μm. (J) Representative TRAP staining showing osteoclastic activity and quantification of osteoclast numbers and surface on the trabecular in extraction socket. Scale bars: 50 μm. Results are presented as the mean ± S.D. *p < 0.05; **p < 0.01; #p > 0.05 by two-way ANOVA, n = 6 mice per group.

