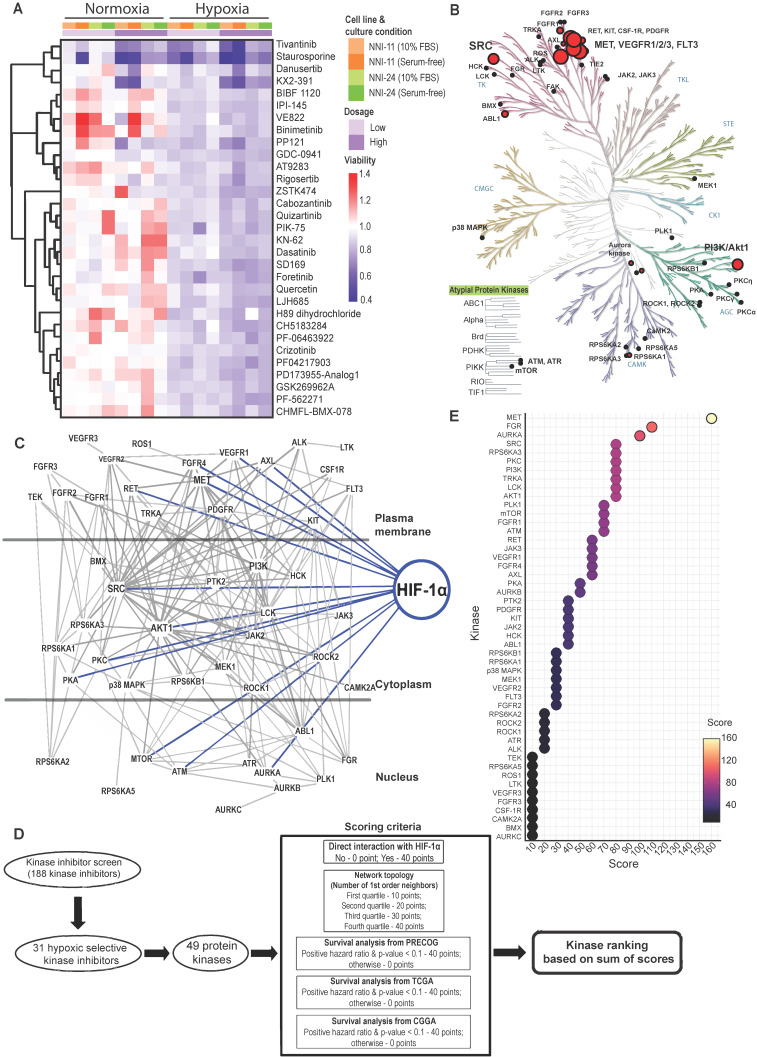
Figure 1.
Kinome landscape in hypoxic adaptation of GPCs. (A) Selected kinase inhibitors with hypoxia-selective cytotoxicity in GPCs. The cell viability (relative to DMSO-treated cells) is color-coded. Blue color indicates reduced viability, while red color indicates increased viability compared to DMSO-treated cells. (B) Protein kinases targeted by hypoxic-selective small-molecule inhibitors. Implicated kinases are highlighted in red circles. Sizes of the circles indicate the number of shortlisted inhibitors targeting the kinases (i.e., a larger circle implies a higher number of inhibitors targeting the kinase; min: 1 inhibitor, max: 5 inhibitors). (C) Gene connectivity network generated based on the molecular targets of hypoxic selective inhibitors using Ingenuity Pathway Analysis. Dark grey lines indicate the kinase-kinase interactions, while blue lines indicate HIF-1α-kinase interactions. (D) Workflow and scoring criteria used in the unweighted ranking analysis. Protein kinases are ranked based on the connectivity network and the correlation between their expressions and GBM patients' overall survival. (E) Kinase ranking based on the unweighted sum of scores of each protein kinase. Higher ranks predict a more important role of the kinase in tumor hypoxia of GPCs based on the network analysis and clinical data.

