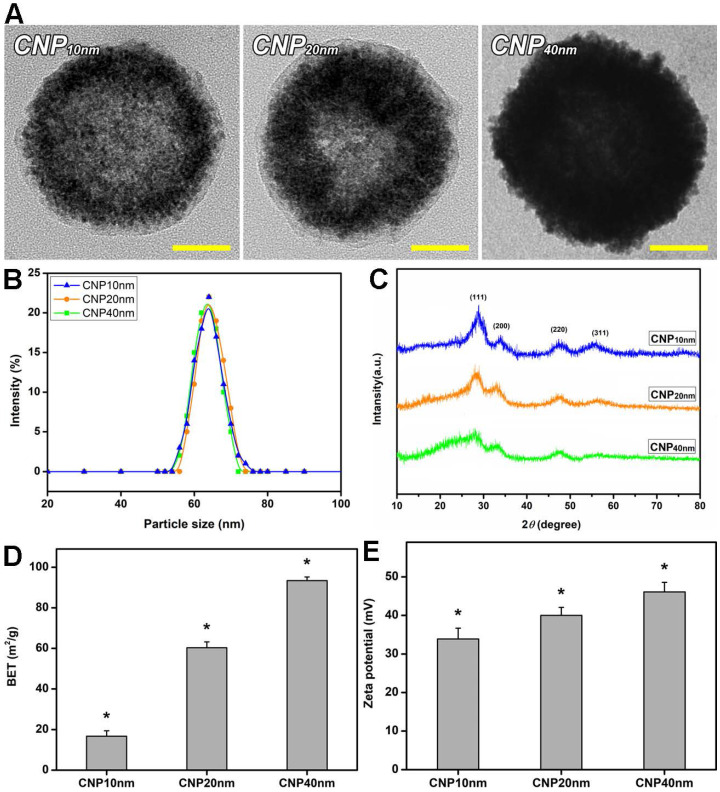
Figure 1.
Material characterization. (A) Representative TEM images, (B) DLS measurements, (C) XRD patterns, (D) BET surface areas, and (E) zeta potentials of surface-modified HMCNs fabricated using different solvothermal deposition and infiltration times. Values are mean ± SD (n = 5). *P < 0.05 vs all groups. Scale bars: 20 nm.

