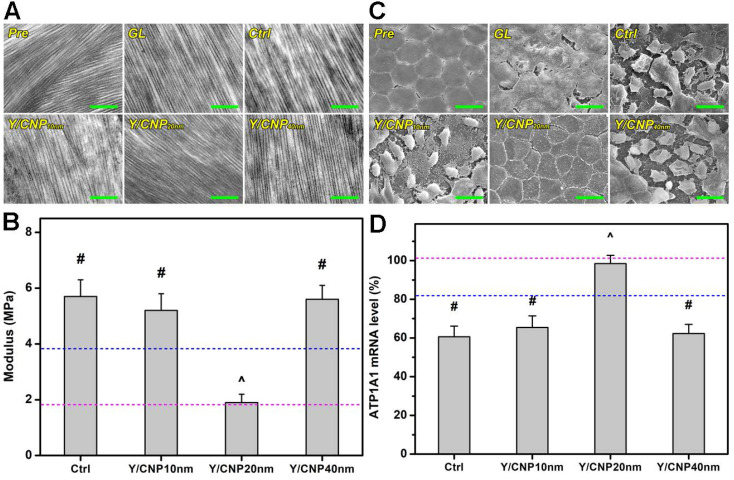
Figure 5.
In vivo studies on shell thickness effects on corneal structure of glaucomatous eyes. (A) Typical TEM images of corneal stroma from different rabbit eyes. Scale bars: 1 µm. (B) Young's modulus of corneal tissues; pink and blue dotted lines showing the values of Pre and GL groups, respectively. Values are mean ± SD (n = 6). #P < 0.05 vs Pre, GL and Y/CNP20 nm groups; ^P < 0.05 vs GL, Ctrl, Y/CNP10 nm and Y/CNP40 nm groups. (C) Representative SEM images of endothelium of different rabbit eyes. Scale bars: 20 µm. (D) ATP1A1 mRNA levels from endothelium tissues of different rabbit eyes; pink and blue dotted lines showing the values of Pre and GL groups, respectively. Values are mean ± SD (n = 6). #P < 0.05 vs Pre, GL, and Y/CNP20 nm groups; ^P < 0.05 vs GL, Ctrl, Y/CNP10 nm and Y/CNP40 nm groups. Ocular tissues were harvested from test rabbit eyes at 10 days post single administration (50 µL of Y-27632-loaded HMCN solution, a mixture of 2% w/v Y-27632 and 1 mg/mL of HMCNs).

