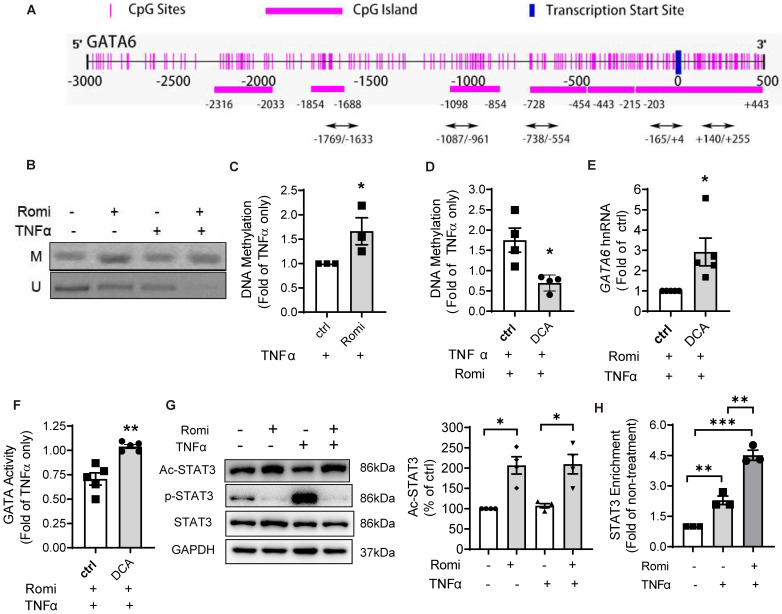
Figure 3.
HDAC1/2 modulated the methylation of GATA6 promoter region and enrichment of STAT3 to GATA6 promoter. (A) Schematic illustration of seven CpG islands in human GATA6 promoter. There are two CpG islands contained in -203/+443. Primers were designed to amplify the five CpG-rich regions. (B) After treatment, GATA6 promoter methylation in CpG-rich region +144/+255 was evaluated by methylation-specific PCR (MSP) assay with primers targeting the methylated (M) or unmethylated (U) cytosines. Shown are representative agarose gel electrophoresis images. (C) GATA6 methylation at +144/+255 was quantified with real-time PCR with methylated cytosines-targeting primers and normalized to UBB expression (n = 3). (D-F) HAEC were pretreated with Romidepsin alone or together with DCA (5 µM) for 1 h followed by stimulation with TNFα. (D) GATA6 promoter methylation in +144/+255 region was quantified as in (C) (n = 4). (E) GATA6 hnRNA expression was measured as in 2E (n = 5). (F), GATA activity was examined as in 2F (n = 5). (G) HAEC were pretreated with Romi for 1 h before stimulation with TNFα for 4 h. The phosphorylation at Tyr705 and acetylation at Lys685 of STAT3 were then analyzed with Western blotting (n = 4). Shown right is quantification of Ac-STAT3 protein. (H) HAEC were incubated with Romi for 1 h followed by 4 h treatment with 1 ng/mL TNFα. A chromatin immunoprecipitation assay was applied to examine enrichment of STAT3 onto +84/+94 site of GATA6 promoter (n = 3). *p < 0.05; **p < 0.01; ***p < 0.001 vs ctrl, two-tailed t-test, C, D, F); one sample t-test (E); repeated measures one-way ANOVA followed by Tukey's test (G, H).

