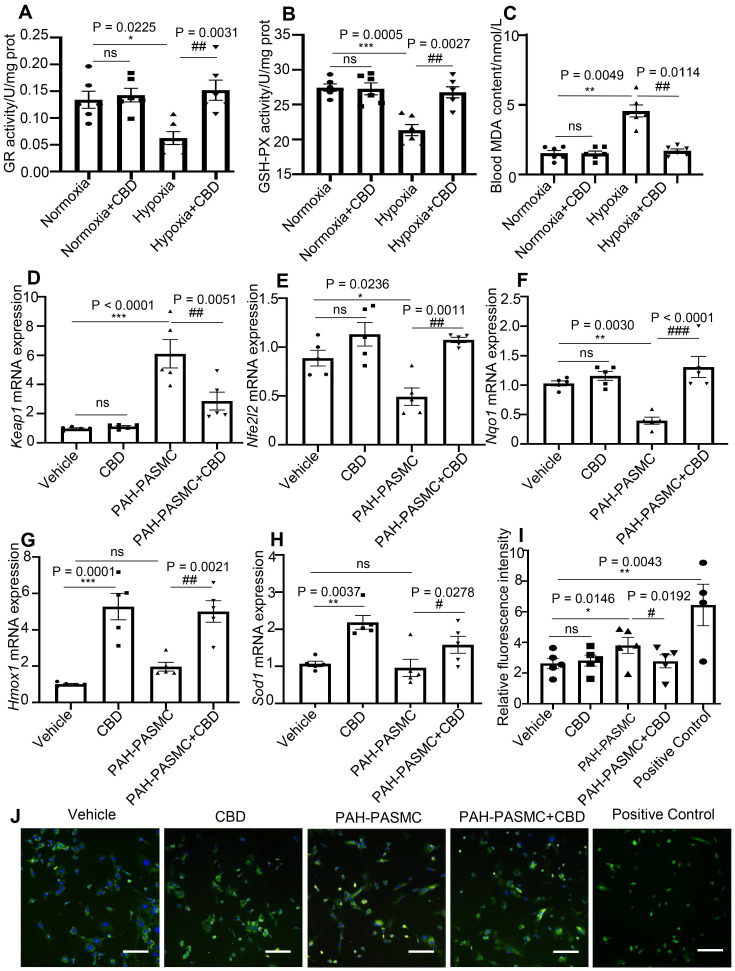
Figure 5.
Analysis of the protection effect of CBD on oxidant stress. A-B, Quantification of enzyme activities of GR and GSH-PX in the lungs of hypoxia-induced preventive PAH mice, n = 6 per group. C, MDA content in the blood of preventive hypoxia-induced PAH mice, n = 6 per group. D-H, mRNA levels of Keap1, Nfe2l2, Nqo1, Hmox1 and Sod1 quantified using RT-PCR in PASMCs, which were isolated from control and PAH mice after the treatment with CBD (10 µM) or control vehicle, were n = 5 per group. I, Quantification of ROS with a fluorescence 96-plate by a fluorescence microplate reader, DCFH-DA fluorescence intensity in PASMCs isolated from control and PAH mice after the treatment with CBD (10 µM) or control vehicle or rosup (provided in the kit as a positive control for ROS) for 2 h, n = 8 per group. J, Representative images of ROS fluorescence in PASMCs isolated from control and PAH mice, assessed by laser scanning microscope. Nuclei was counterstained using DAPI, n≥7 per group. Scale bar = 100 µm. The results were analyzed by one-way ANOVA followed by Bonferroni's multiple comparison test, *P < 0.05, **P < 0.01, ***P < 0.001 vs. the control group, and #P < 0.05, ##P < 0.01, ###P < 0.001 vs. the mice PAH-PASMCs group.

