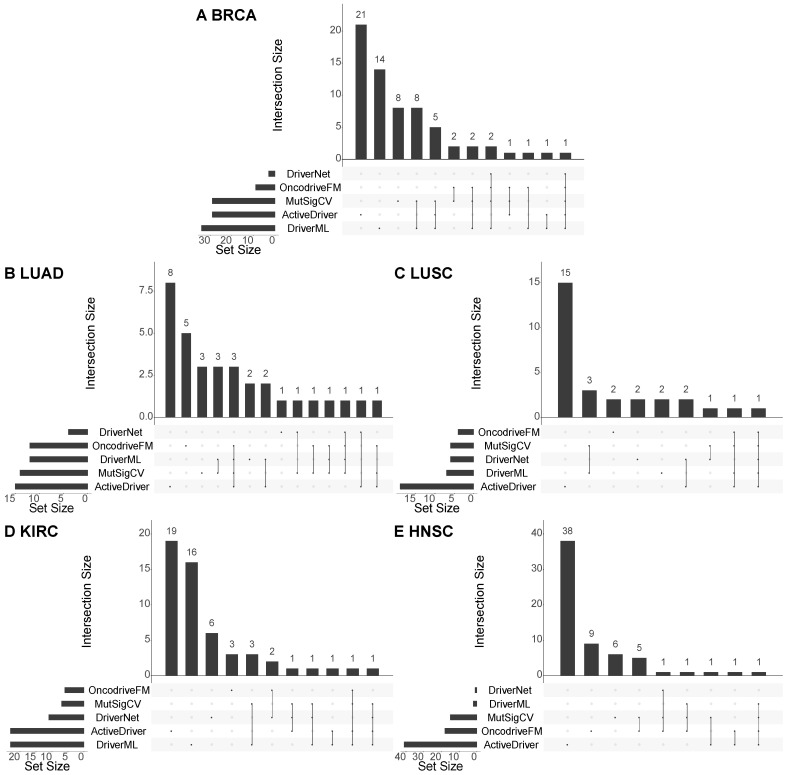
Figure 4.
Overlap among the cancer drivers predicted by different methods. The charts illustrate the overlap among the cancer drivers at the population level predicted by the five methods (DriverML, ActiveDriver, DriverNet, MutSigCV, and OncodriveFM) w.r.t the five cancer types, including BRCA, LUAD, LUSC, KIRC, and HNSC. In each chart, the horizontal bars at the bottom left show the number of detected cancer drivers validated by the CGC, the vertical bars and the dotted lines show the overlap of the validated cancer drivers of the methods. If there is not an overlap, it will be a black dot.

