Figure 2.
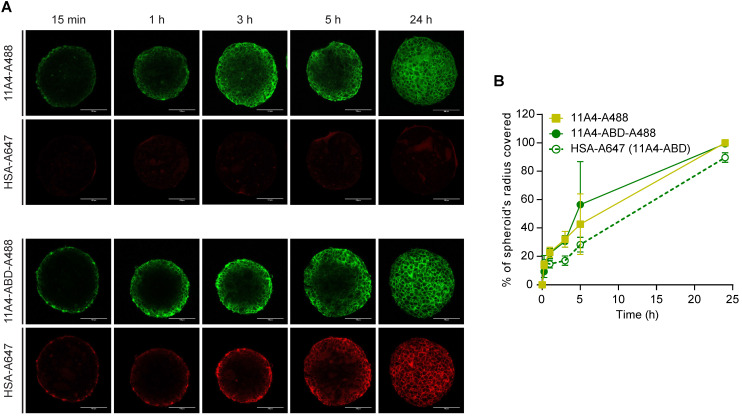
Distribution of fluorescent nanobodies in HSA pre-treated BT-474 spheroids. A) Representative confocal images of a central z-plane of BT-474 spheroids incubated with 25 nM of Alexa488 conjugated 11A4 (11A4-A488) or 11A4-ABD (11A4-ABD-A488) in the presence of equimolar amount of Alexa647-conjugated HSA (HSA-A647). Scale bar = 100 µm. B) Displacement profile, expressed as % of spheroid's radius, of 11A4-A488 (yellow squares), 11A4-ABD-A488 (green filled circles, continuous line) and HSA-A647 in 11A4-ABD-incubated spheroids (green open circles, dashed line) over time. No HSA-A647 signal was observed in 11A4-A488-incubated spheroids. For quantification details see also Figure S2. Values were plotted as mean ± SD (n = 10) and data points are linked with a connecting line.

