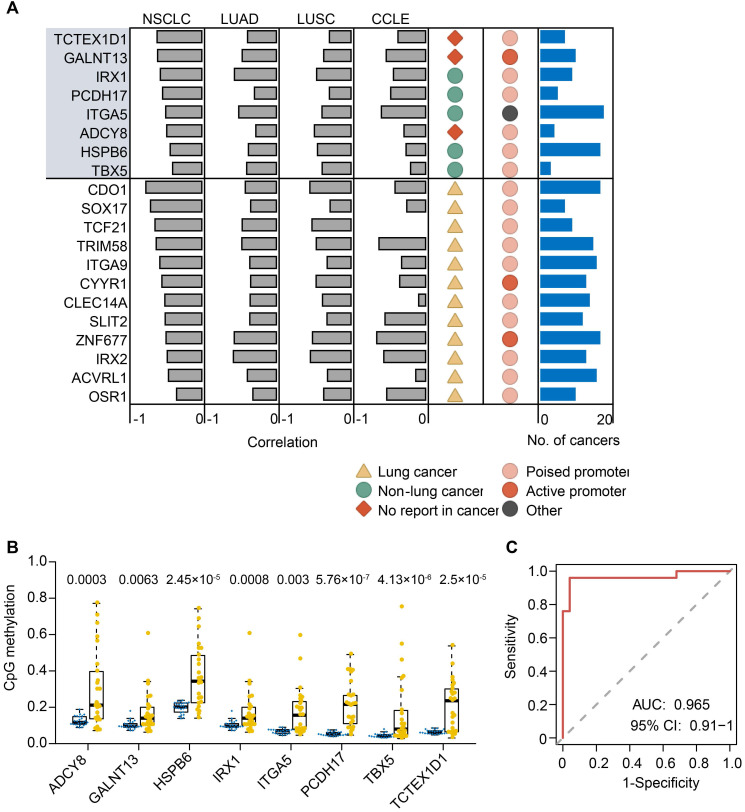
Figure 5.
Methylation-silenced driver genes in lung cancer. (A) 20 methylation driver genes identified in lung cancer. Grey bars indicate the Spearman correlation calculated from our NSCLC data, TCGA LUAD and LUSC, and CCLE database. The dark yellow triangle indicates known methylation drivers in lung cancer, spring green circle indicates known methylation drivers in non-lung cancer, and the Indian red rhombus indicates first report in cancer. Light and dark red circles indicate genes pre-marked by poised and active promoter in ESCs, respectively. Number of cancer types from TCGA cohorts (blue bar) that detected the same methylation drivers is plotted in the right panel. (B) Validation of methylation changes of eight novel methylation driver genes in an independent cohort (23 paired tumor and normal tissues) by bisulfite pyrosequencing. The box indicates the median±1 quartile with each point representing one sample (yellow for tumors and blue for normal tissues). (C) ROC curve for random forest analysis using pyrosequencing value inputs of eight novel methylation biomarkers from an independent cohort. ROC analysis yielded an AUC of 0.965, showing high accuracy of distinguishing tumors from normal tissues.

