Figure 6.
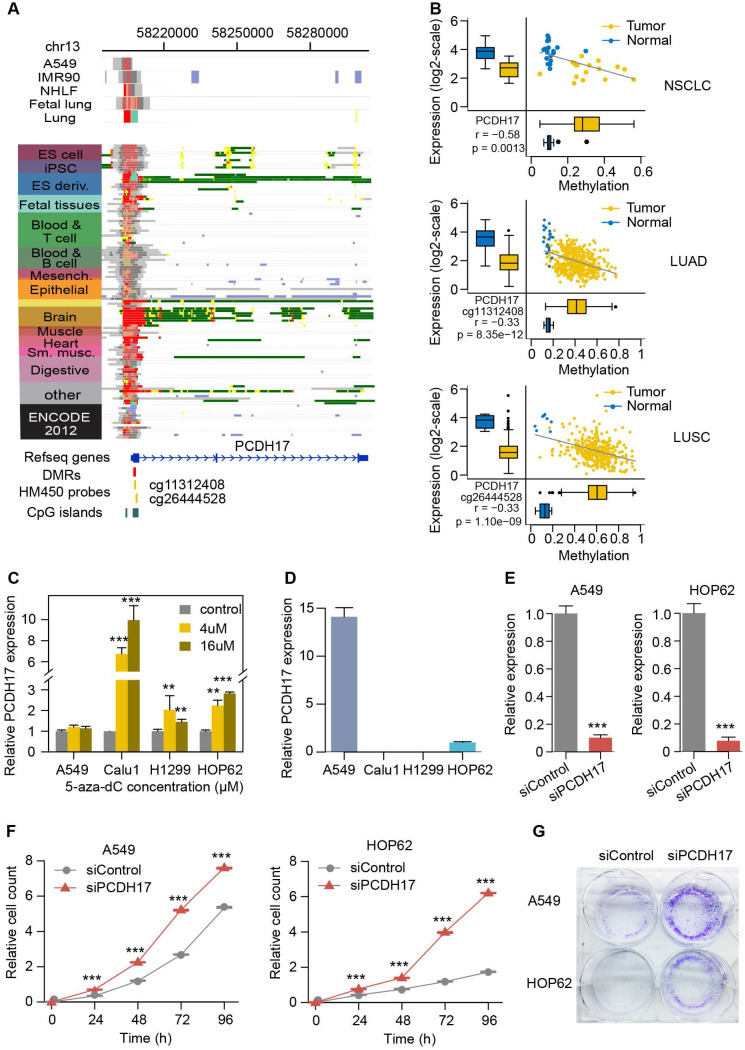
Functional validation of PCDH17. (A) The epigenomic chromatin profile of DMR in the PCDH17 promoter. Color-coded definitions of chromatin states are shown in Figure 2C. The position of DMR is highlighted by the red box. The CpG islands overlapped with the DMR are shown in a green box. The HM450 probes within the DMR are indicated by yellow lines. (B) Scatterplots and box plots of methylation of DMRs/CpGs within the PCDH17 promoter and expression of PCDH17 in RRBS NSCLC (top), TCGA LUAD (middle) and TCGA LUSC (bottom) cohorts. (C) Relative expression of PCDH17 after treatment with increasing concentration of 5-aza-dC in lung cancer cell lines A549, Calu1, H1299, and HOP62. (D) Relative expression of PCDH17 in lung cancer cell lines A549, Calu1, H1299, and HOP62. (E) Relative expression change of PCDH17 in A549 and HOP62 cells transfected with PCDH17 siRNA or control siRNA. (F) Growth curves of A549 and HOP62 cells transfected with PCDH17 siRNA or control siRNA. (G) Colony formation assays in A549 and HOP62 cells transfected with PCDH17 siRNA or control siRNA. The error bars indicate SD of three independent experiments. *P <0.05, **P <0.01, ***P <0.001 using a two-sided Student's t-test.

