Figure 7.
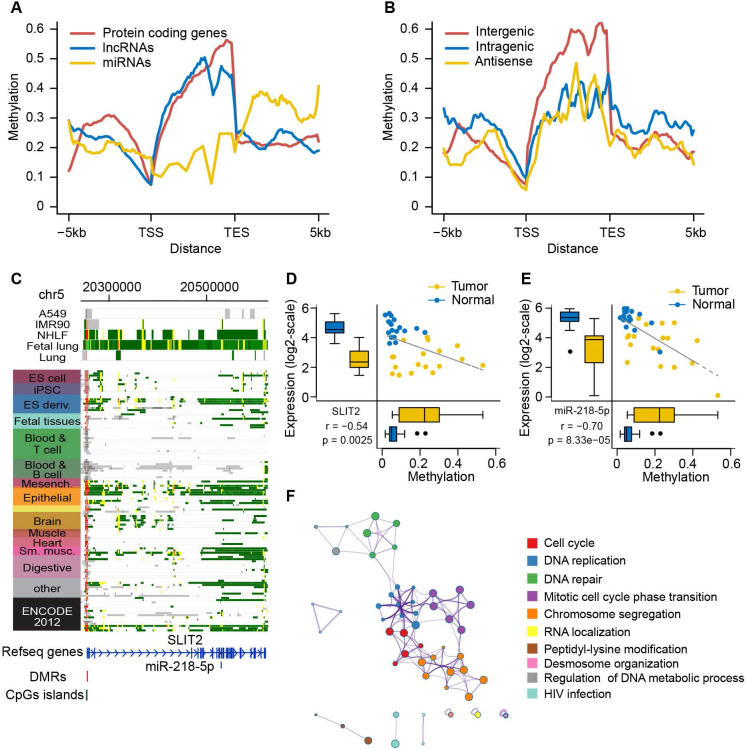
DNA methylation alterations control expression of ncRNAs and their host genes. (A) DNA methylation patterns of protein-coding genes and ncRNAs (lncRNAs and miRNAs) across the gene body and ±5kb flanking regions of the gene body. DNA methylation level is calculated according to 1kb windows with 100bp steps in lung normal samples. (B) DNA methylation patterns of three different subcategories of lncRNAs (intergenic, intragenic and antisense) across the gene body and ±5kb flanking the gene body. (C) The epigenomic chromatin profile of DMR in miR-218 and its host gene SLIT2 promoter. Color-coded definitions of chromatin states are shown in Figure 2C. The position of DMR is highlighted by the red box. The CpG islands overlapped with the DMR are shown in the green box. (D) Scatterplots and box plots of methylation of DMR within the SLIT2 promoter and its expression in the RRBS cohort. (E) Scatterplots and box plots of methylation of DMR within the promoter of SLIT2 and expression of miR-218 in the RRBS cohort. (F) The computational prediction, biological process that miR-218 is involved in.

