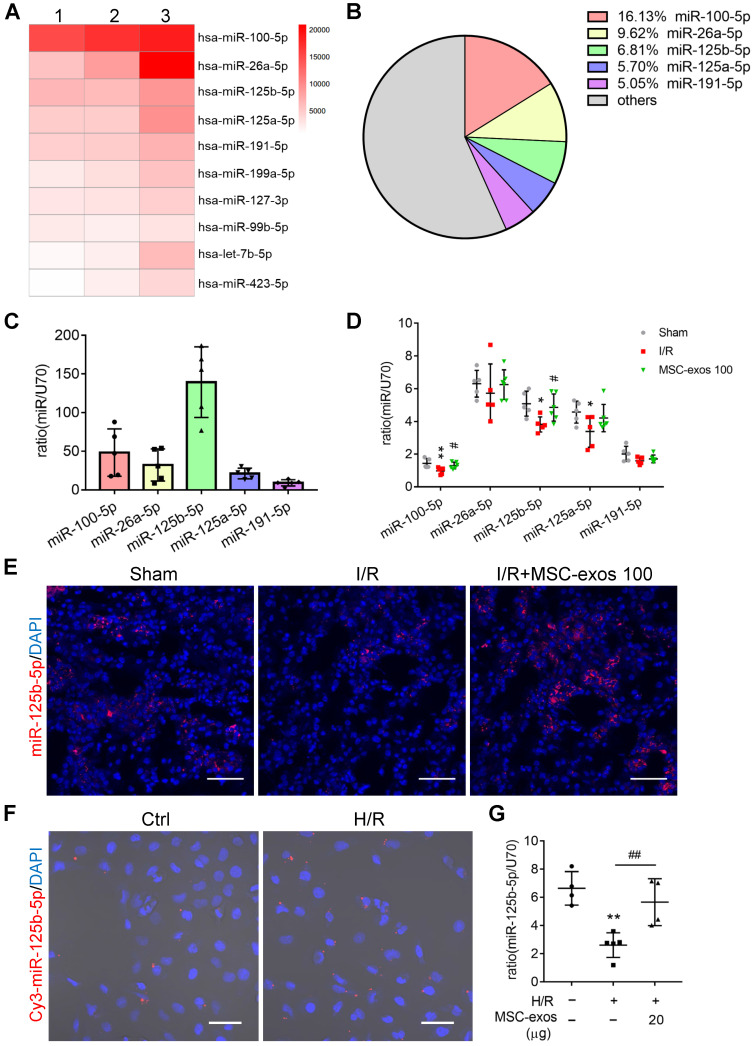
Figure 6.
miR-125b-5p is enriched in MSC-exos and delivers to TECs. (A) Heat map of the top ten most abundant miRNAs in MSC-exos by miRNA-seq. (B) Relative percentage of miRNAs in total miRNA reads. (C) RT-PCR analysis of the top five most abundant miRNAs in MSC-exos (n = 5). (D) RT-PCR analysis of the top five miRNAs in MSC-exos-treated mice renal tissues (n = 5-6). (E) FISH analysis of miR-125b-5p in kidney tissues. Scale bars, 50 µm. (F) Representative images of Cy3-miR-125b-5p mimic-MSC-exos internalized by HK-2 cells. Scale bars, 50 µm. (G) RT-PCR analysis of miR-125b-5p in HK-2 cells (n = 4-5). Data are presented as mean ± SD, *p < 0.05, **p < 0.01 vs. sham group or control group, #p < 0.05, ##p < 0.01 vs. I/R or H/R group, one-way ANOVA.

