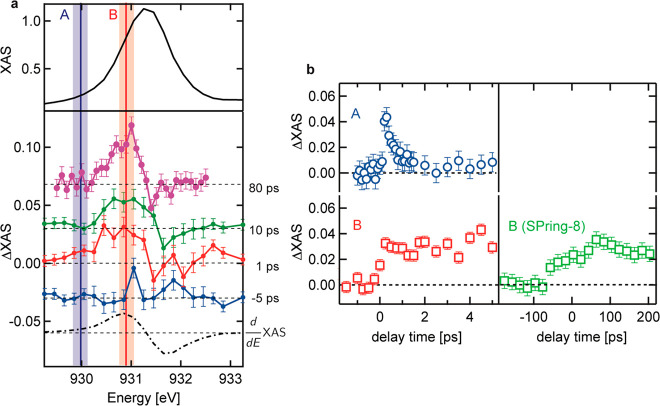
Figure 2.
(a) Normalized Cu L3 XAS (top panel) and the transient X-ray absorption spectroscopy (XAS) data of Cu L3 edge in CuWO4 at several delay times (−5, 1, 10, and 80 ps with respect to −10 ps) (bottom panel). The transient XAS spectra were normalized according to the reference Cu L3 XAS. (b) Kinetic traces of the Cu L3 edge at peaks A and B measured at PAL-XFEL and the kinetic trace of Cu L3 edge XAS at peak B for longer delay times measured at SPring-8. The intensities were normalized according to the reference Cu L3 XAS. The error bars for the transient XAS were estimated from the standard deviation of the transient XAS at a negative delay time. Due to shot-by-shot variations of the X-ray intensity, there remains a point-by-point error that can be larger than the standard deviation. The error bars for the kinetic traces were estimated from the standard deviation of the unpumped XAS intensity.

