Figure 3.
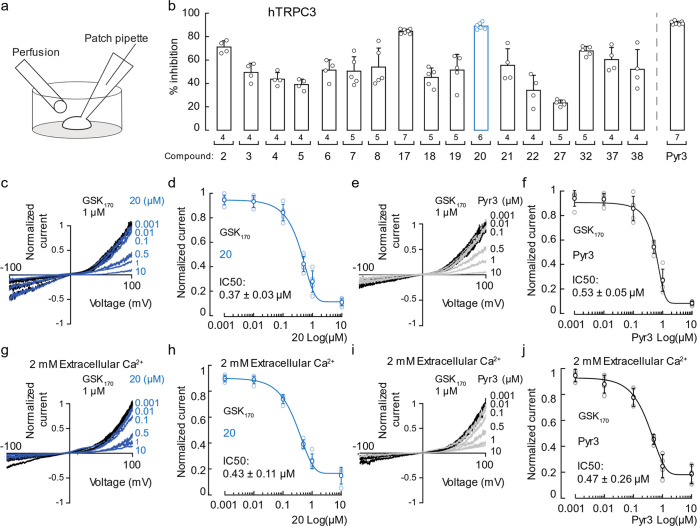
Inhibition of TRPC3-mediated currents by synthesized compounds. (a) Cartoon depicting the experimental conditions used to test the effect of the synthesized compounds on HEK293 cells overexpressing hTRPC3. TRPC3 currents were measured in the whole-cell configuration of the patch-clamp technique, and cells were challenged with agonists/antagonists through perfusion. (b) Percentage of hTRPC3 currents elicited by GSK170 and inhibited by the synthesized compounds in transfected HEK293 cells. Bars represent mean ± SD; n is denoted above the x-axis. (c) Representative traces of hTRPC3 currents activated by 1 μM GSK170 and inhibited at different concentrations of compound 20 (blue traces). Each concentration was tested on independent cells and normalized against its internal control (maximum amplitude) to avoid tachyphylaxis. (d) Dose–response profile of hTRPC3 currents elicited by 1 μM GSK170 and inhibited at different concentrations of compound 20. Circles represent mean ± SD. (e) Representative traces of hTRPC3 currents activated by 1 μM GSK170 and inhibited at different concentrations of Pyr3 (gray traces). Each concentration was tested on independent cells and normalized against its internal control (maximum amplitude) to avoid tachyphylaxis. (f) Dose–response profile of hTRPC3 currents elicited by 1 μM GSK170 and inhibited at different concentrations of Pyr3. Circles represent mean ± SD. (g) Representative traces of hTRPC3 currents activated by 1 μM GSK170 and inhibited at different concentrations of compound 20 (blue traces) in the presence of extracellular Ca2+ (2 mM). Each concentration was tested on independent cells and normalized against its internal control (maximum amplitude) to avoid tachyphylaxis. (h) Dose–response profile of hTRPC3 currents elicited by 1 μM GSK170 and inhibited at different concentrations of compound 20 in the presence of extracellular Ca2+ (2 mM). Circles represent mean ± SD. (i) Representative traces of hTRPC3 currents activated by 1 μM GSK170 and inhibited at different concentrations of Pyr3 (gray traces) in the presence of extracellular Ca2+ (2 mM). Each concentration was tested on independent cells and normalized against its internal control (maximum amplitude) to avoid tachyphylaxis. (j) Dose–response profile of hTRPC3 currents elicited by 1 μM GSK170 and inhibited at different concentrations of Pyr3 in the presence of extracellular Ca2+ (2 mM). Circles represent mean ± SD. GSK170: GSK1702934A.

