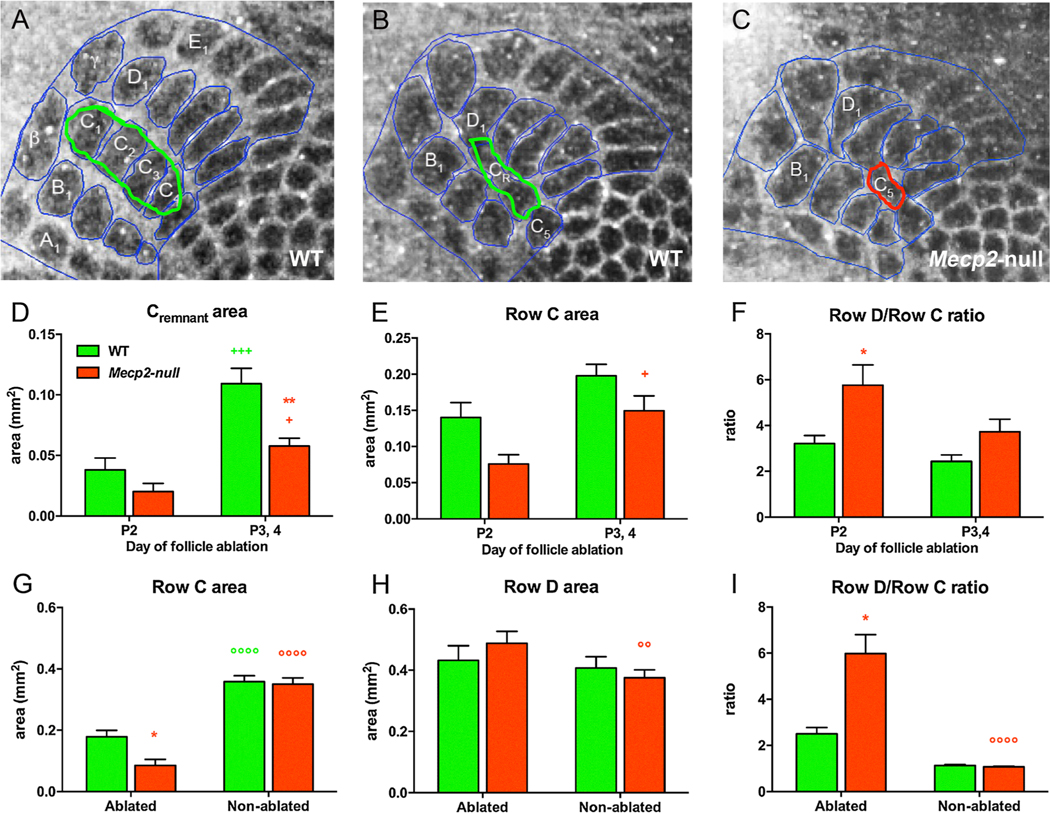
Fig. 7.
Follicle ablation plasticity is altered in Mecp2-null mice. Barrel field organization post-follicle ablation on P2 is depicted by cytochrome oxidase staining in (A)–(C). (A) is from the right (non-ablated) side and (B) is from the left (ablated) side of a WT mouse. (C) is the barrel field on the ablated side of a Mecp2-null mouse. (D) When FA was performed at P3, 4, Row C remnant (CR) did not shrink as much as when lesions were performed at P2 in both WT (n = 5) and Mecp2-null mice (n = 8) (+++, + respectively). The area of CR was significantly decreased in Mecp2-null compared to WT mice after P3/4 post-ablation (**). (E) The area of Row C was larger in Mecp2-null mice when FA was performed at P3,4 versus P2 (+). (F) The ratio of Row D to Row C was used as a measure of experience-induced plasticity. After FA on P2, the Row D/Row C ratio on the ablated side was significantly larger in Mecp2-null than in WT mice (*). (G) Regardless of genotype, the area of Row C was larger on the intact, non-ablated side (°°°°for WT and for Mecp2-null). On the ablated side, Row C area was significantly smaller in Mecp2-null mice than in the WT (*). (H) Neighboring Row D area was not statistically different on the ablated or intact side of WT mice but was smaller on the intact side than on the ablated side in Mecp2-null mice (°°). (I) The Row D/Row C ratio was significantly smaller on the intact side in Mecp2-null mice (°°°°) and as a result was larger in Mecp2-null mice than in WT mice on the ablated side (*). Genotype differences are red* for WT versus Mecp2-null mice; differences between day of follicle ablation are denoted with green+ for WT mice and red+ for Mecp2-null mice; green° denote differences between the ablated versus the non-ablated side for WT mice and red° denote differences between the ablated versus the non-ablated side for Mecp2-null mice. The numbers of symbols refer to p values (+ or *p < 0.05, °°p < 0.01, +++ p < 0.001, °°°°p < 0.0001).

