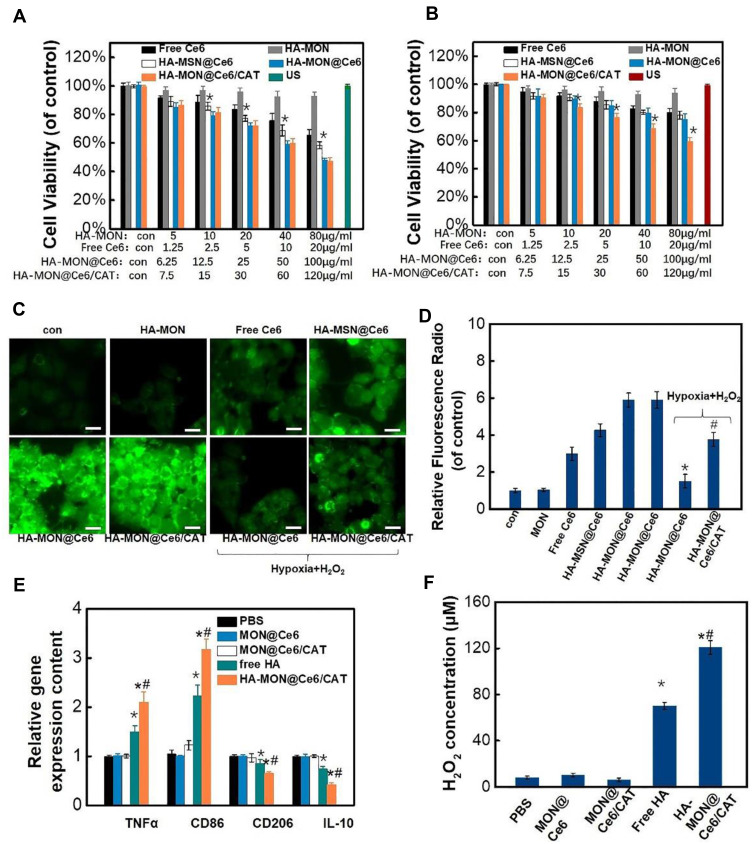
Figure 2.
In vitro SDT effect and the reeducation of macrophages. Cytotoxicity of these nanoparticles in normoxic (A) and hypoxic (B) MCF-7 cells after exposed with US, *p < 0.05 versus MON@Ce6 groups (n = 6). (C) Intracellular reactive oxygen species (ROS) fluorescence images (bars =10 µm). (D) FACS quantitative analysis of ROS, *p < 0.05 versus HA-MON@Ce6 groups (normoxia), #p < 0.05 versus MON@Ce6 (hypoxia) groups (n = 6). (E) TNFα, CD86, CD206 and IL10 gene expression of cells after various treatments. *p < 0.05 versus PBS groups; #p < 0.05 versus free HA group (n = 6). (F) The secretion of H2O2 by macrophages after various treatments. *p < 0.05 versus PBS groups; #p < 0.05 versus free HA group. All the data represent the mean ± SD (n = 6).

