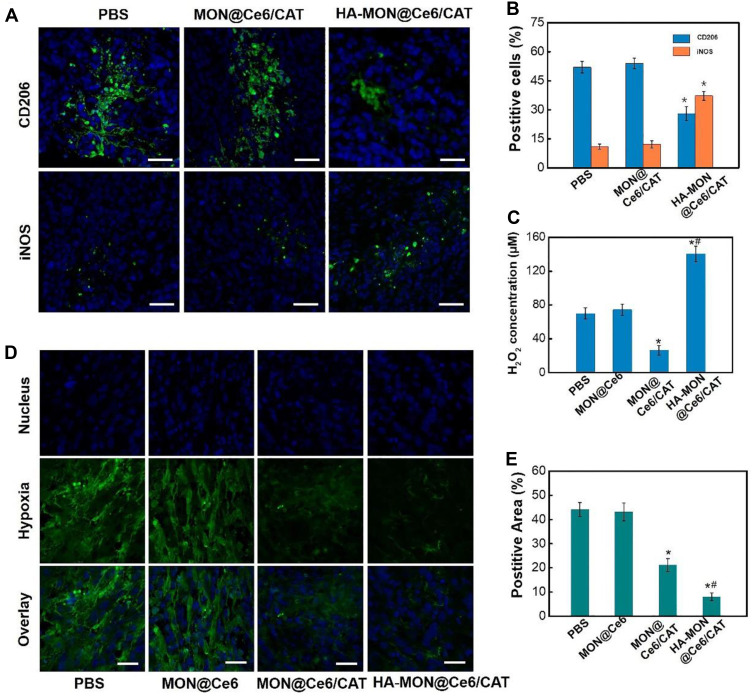
Figure 3.
Polarization of tumor-associated macrophages by HA-MON@Ce6/CAT. (A) Immunofluorescence image of tumor sections stained with CD206 antibody and iNOS antibody after MON@Ce6/CAT and HA- MON@Ce6/CAT administration, scale bar =50 μm. (B) Flow cytometric assay of the phenotype of macrophages. *p < 0.05 versus PBS groups. Data represent the mean ± SD (n = 3). (C) H2O2 level of tumor tissues after administrated with MON@Ce6, MON@Ce6/CAT and HA- MON@Ce6/CAT. *p < 0.05 versus PBS groups; #p < 0.05 versus free MON@Ce6/CAT group. Data represent the mean ± SD (n = 3). (D) Immunofluorescence image of tumor sections stained with antipimonidazole antibody after various administration. (E) Quantitative analysis of hypoxia positive areas. *p < 0.05 versus PBS groups; #p < 0.05 versus MON@Ce6/CAT group. Data represent the mean ± SD (n = 3).

