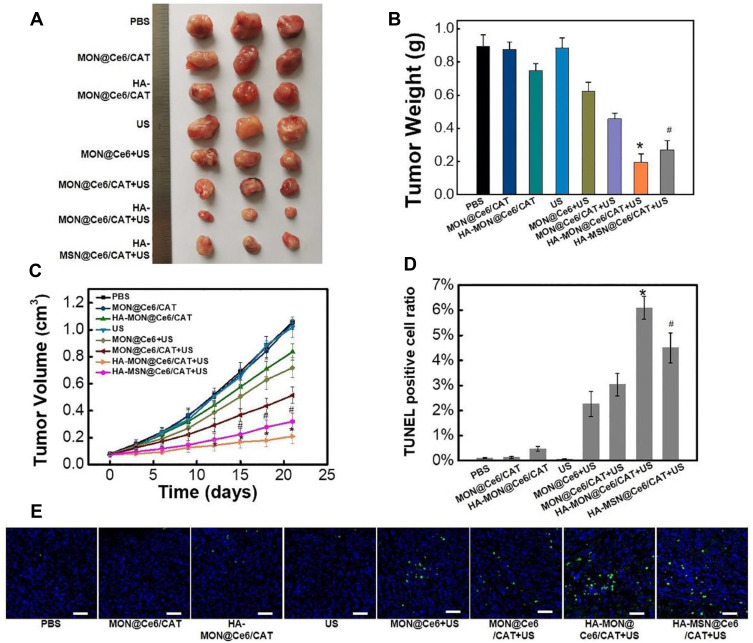
Figure 4.
Antitumor effect. (A) Tumor images. (B) Tumor weights, (C) tumor growth curves, *p < 0.05 versus MON@Ce6/CAT+US groups; #p < 0.05 versus HA-MON@Ce6/CAT+US group. (D) Tumor apoptotic rate analysis in each treatment groups. All the data represent the mean ± SD, *p < 0.05 versus MON@Ce6/CAT+US groups; #p < 0.05 versus HA-MON@Ce6/CAT+US group (n = 3). (E) Images of the TUNEL fluorescent staining. The blue fluorescence represented the nucleus, and the green fluorescence indicated the location of the apoptotic cells; the scale bars = 50 μm.

