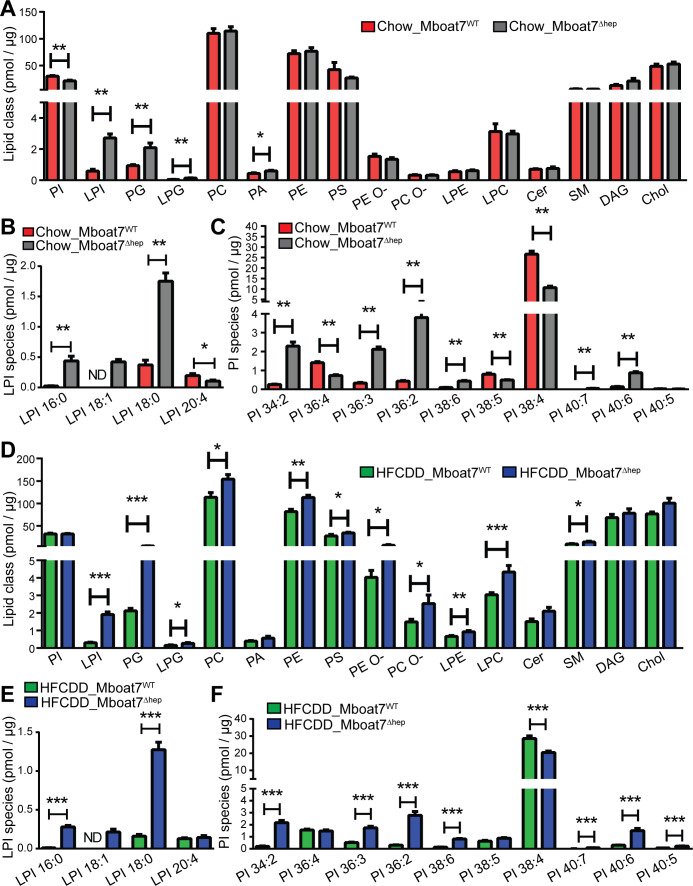
Figure 4.
Lipidomic analysis of mouse liver on normal and HFCDD diet. (A–F) data are presented as mean±SEM. (Mann-Whitney U test). *P<0.05, **P<0.01, ***P<0.001. lipidomic analysis of livers on a normal diet (A–C, n=5 mice) and HFCDD diet (D–F, n=7–8 mice). Cer, ceramides; Chol, cholesterol; DAG, diacylglycerol; HFCDD, high-fat, methionine-low, choline-deficient diet; LPC, lysophosphatidylcholine; LPE, lysophosphatidylethanolamine; LPG, lysophosphatidylglycerol; LPI, lysophosphatidylinositol; MBOAT7, membrane-bound O-acyltransferase domain containing 7; ND, not detected; PA, phosphatidic acid; PC, phosphatidylcholine; PE, phosphatidylethanolamine; PG, phosphatidylglycerol; PI, phosphatidylinositol; SEM, SE of the mean; SM, sphingomyelin.

