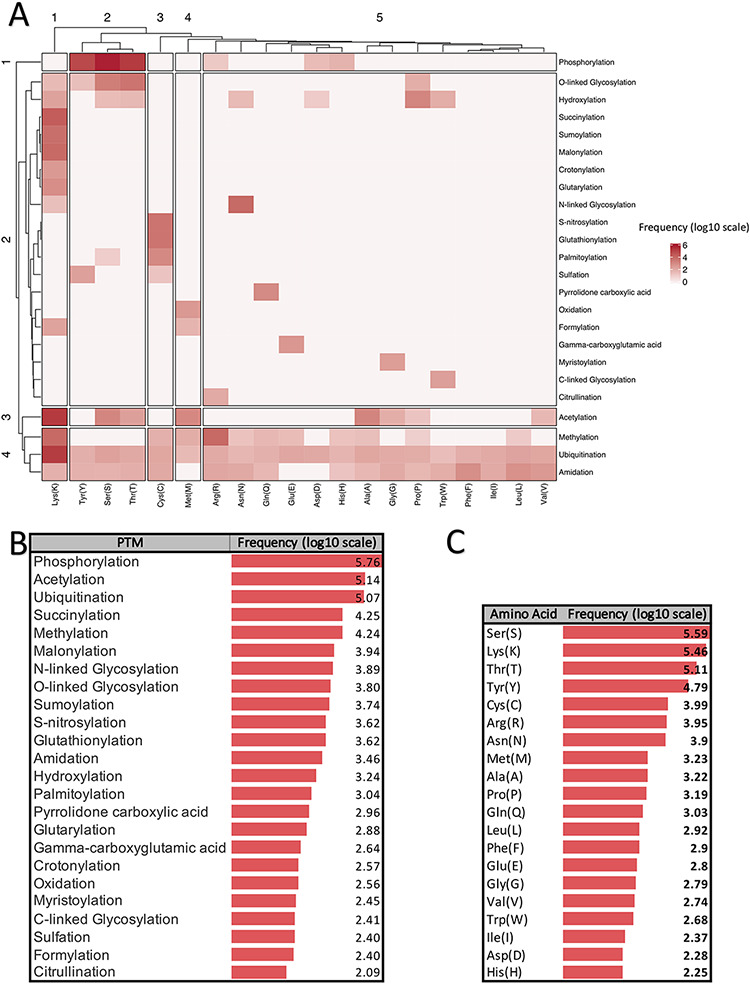
Figure 1.

Summarized information of major PTMs (24 PTMs with more than 80 experimentally verified reported modified sites) according to the dbPTM databank (October 2020). All frequencies are shown in log scale. (A) Clustergram indicating the frequency of each PTM on different amino acids. (B) Frequency of major PTMs. (C) Frequency of each amino acid that was reported as a modified site.
