Figure 5.

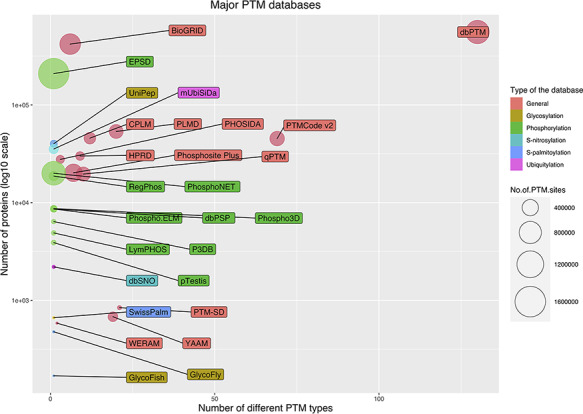
Bubble chart for PTM databases. The chart was drawn based on three parameters for the databases: the number of stored modified proteins, the number of modified sites and the number of covered PTM types.

Bubble chart for PTM databases. The chart was drawn based on three parameters for the databases: the number of stored modified proteins, the number of modified sites and the number of covered PTM types.