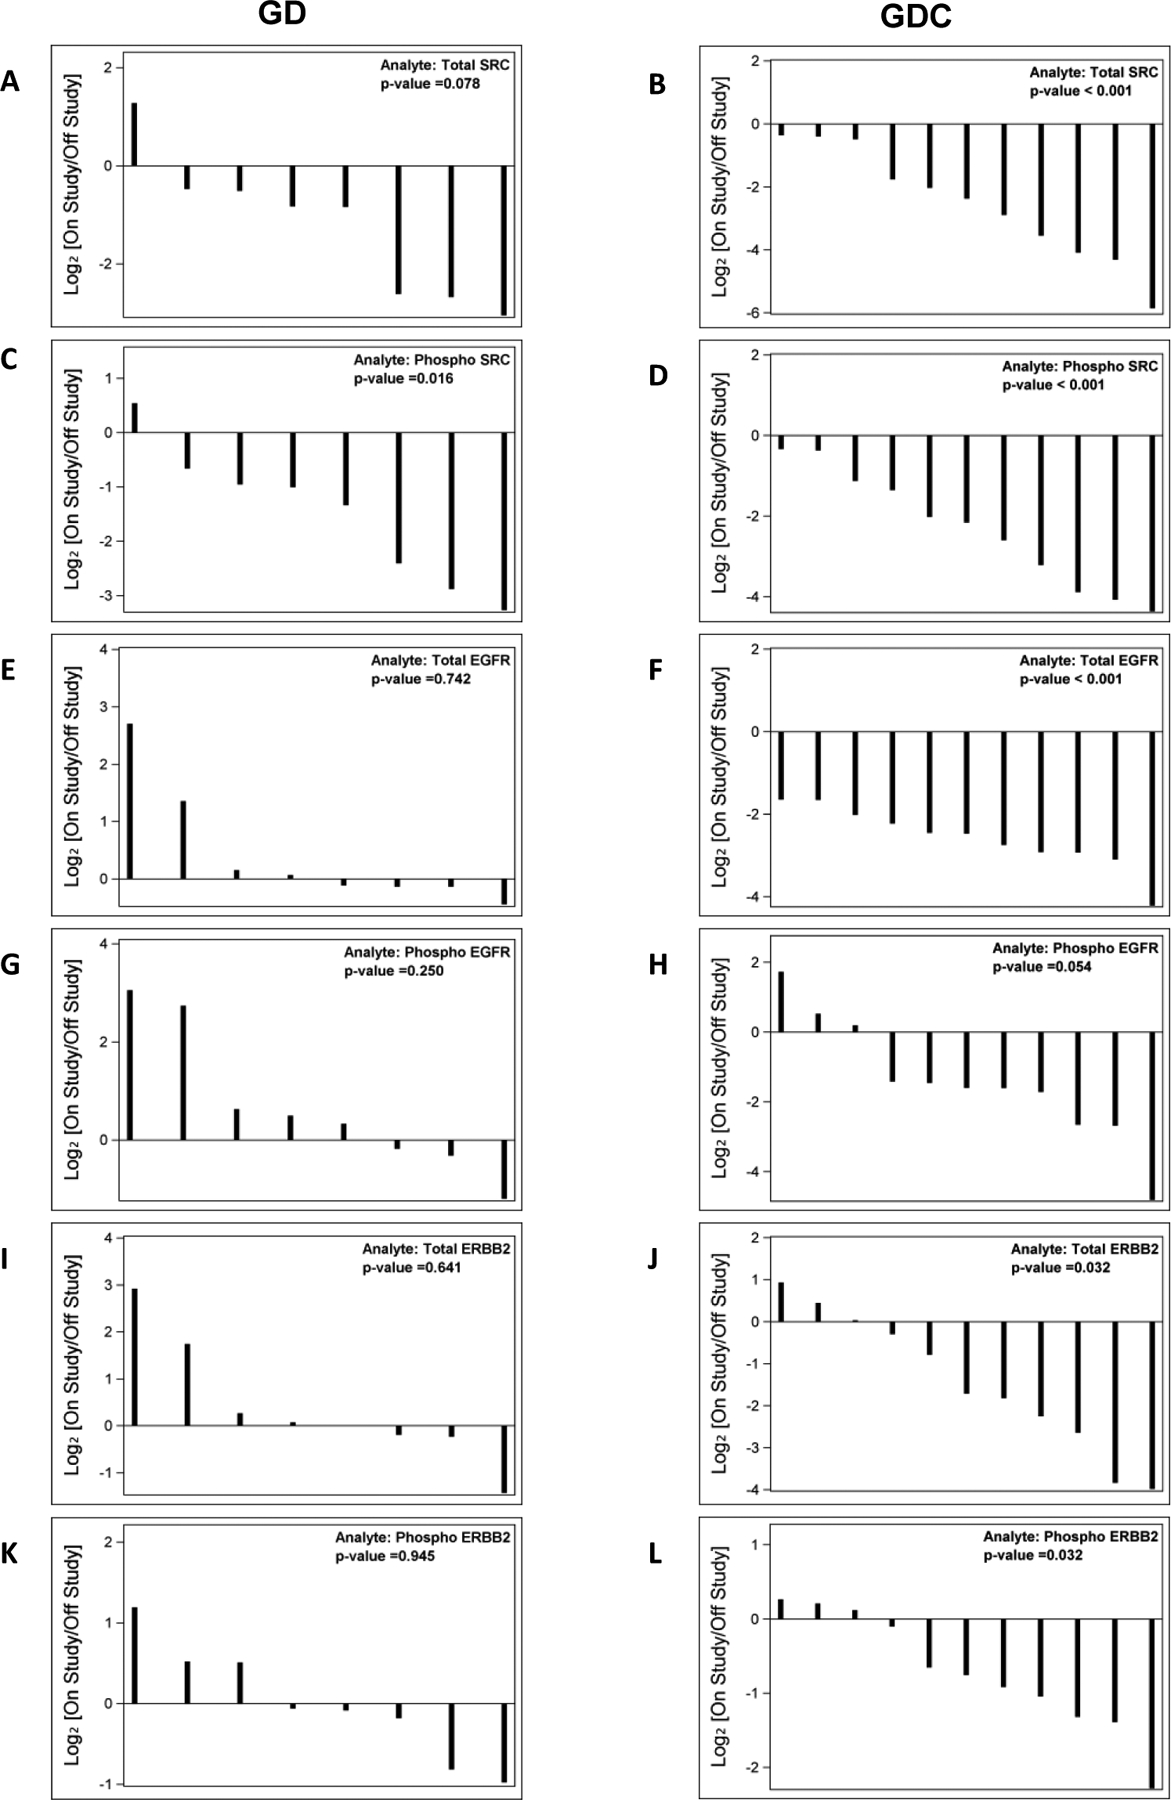
Figure 3. Changes in total and phospho- Src (A-D), total and phospho-EGFR (E-H) and total and phosphor-ErbB2 (I-L) protein levels from baseline.

Waterfall plots on the left represent GD treatment arm and waterfall plots on the right represent GDC treatment arm.
