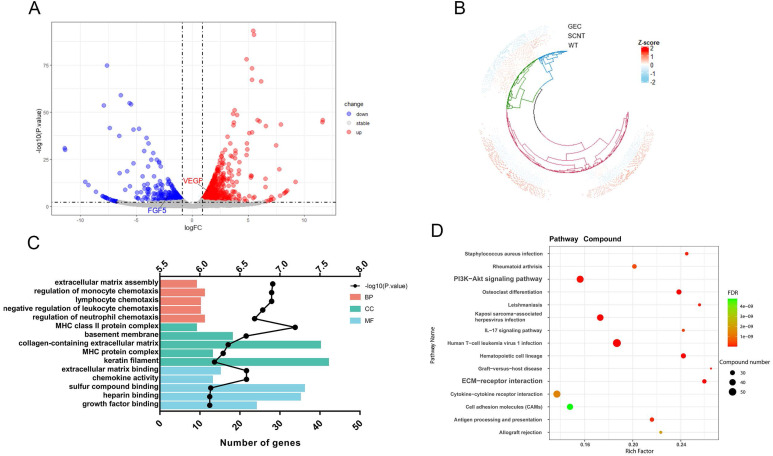
Figure 6.
Skin transcriptome sequencing result of cashmere goats. A. Volcano diagram of transcriptome sequencing. The X-axis is the log2FC value, and the Y-axis is -log10 (P. value). There were 843 genes upregulated and 403 genes downregulated in GEC. B. Cluster analysis of gene expression patterns was performed for all detected genes. C. GO enrichment analysis was performed for all the differentially expressed genes. The Y-axis is the GO term. The top X-axis is -log10 (P. value) and the bottom X-axis is the number of genes in each GO term. D. KEGG enrichment analysis was performed on the differentially expressed genes. We show 15 KEGG pathways with minimum FDR values. The size of the dot represents the number of genes in each pathway.

