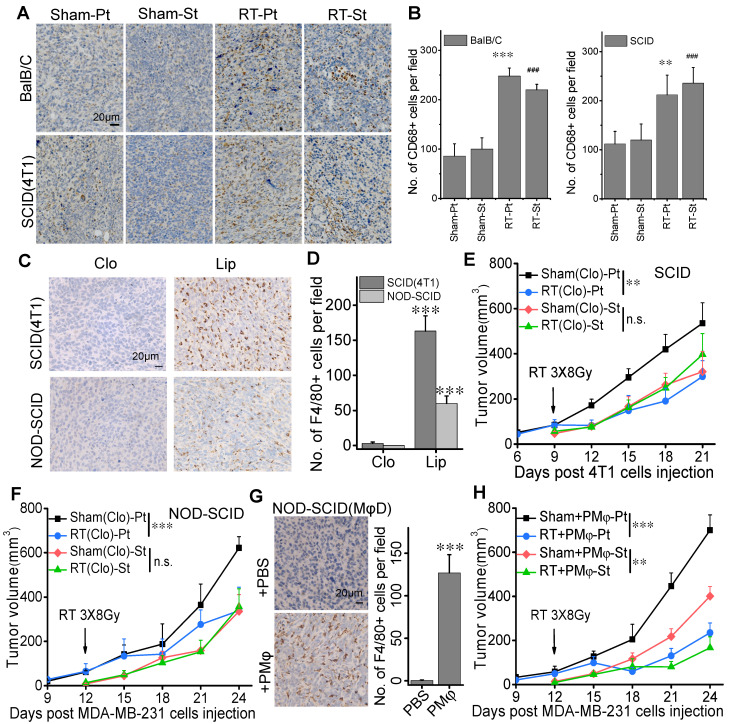
Figure 2.
RIAE was associated with macrophage infiltration in the tumors. Macrophage distribution was identified by CD68 or F4/80 in the primary and secondary tumors in the groups of Sham-Pt, Sham-St, RT-Pt and RT-St, respectively. Cell nuclei (blue) were counterstained with hematoxylin. (A) Representative image of CD68 (brown). (B) Quantification of immunostaining densities in (A) analyzed with Image J software. ** p<0.01 and *** p<0.001 versus Sham-Pt. # p<0.05, ## p<0.01 and ### p<0.001 versus Sham-St. (C) Representative images of F4/80 (brown) in the tumors of SCID(4T1) and NOD-SCID mice that were injected with clodronate (Clo) or its liposome control (Lip) before inoculation of breast cancer cells. (D) Numbers of positive cell per field (IHC, ×400) in (C). *** p<0.001 versus Clo. Growth curves of primary tumor and secondary tumor in SCID(4T1) (E) and NOD-SCID (F) mice with macrophages depletion(MφD). (G) Representative images and numbers of positive cell per field (IHC, ×400) for F4/80 (brown) in the tumor of macrophage depleted NOD-SCID mice with peritoneal macrophage (PMφ) reinfusion. *** p<0.001 versus PBS. (H) Growth of secondary tumor was delayed in the macrophage depleted NOD-SCID mice with PMφ reinfusion after RT. Data from 10 mice/group (n=10) are presented as the mean ± SD. In (E), (F) and (H), ** p<0.01, *** p<0.001, n.s., not significant. Scale bar, indicated in the images.

