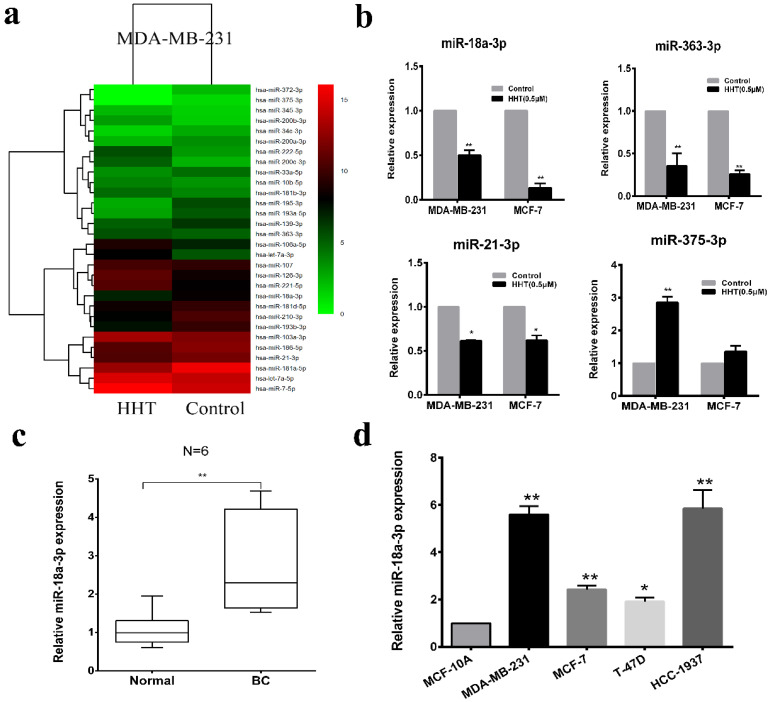
Figure 4.
HHT suppressed miR-18a-3p expression in breast cancer cells. a. The heatmap shows the 30 significantly increased and decreased miRNAs in MDA-MB-231 after HHT treatment by small RNA sequencing. b. Relative expression of the 4 indicated miRNAs listed in (a) measured by RT-qPCR in MDA-MB-231 and MCF-7 cells. c. Relative expression of miR-18a-3p from 6 breast cancer tissues and adjacent non-tumor tissues. The expression levels of miR-18a-3p in 6 breast cancer cell lines and one normal breast epithelial cell line, MCF-10A.

