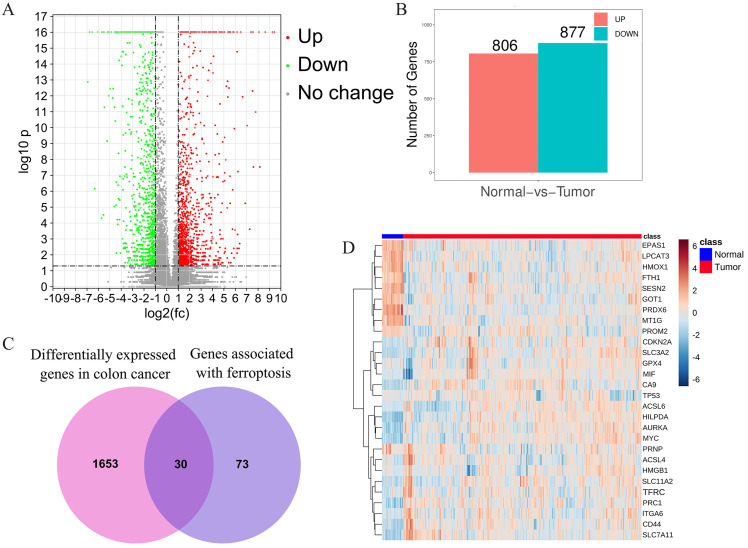
Figure 1.
Identification of the candidate ferroptosis-related genes in the TCGA cohort. A.Volcano plots, used to identify differentially expressed genes between tumors and normal tissues; B.Statistics on the results of volcano plots; C.Venn diagram to identify ferroptosis-related differentially expressed genes between tumor and adjacent normal tissue; D. The expression trend of 30 overlapping genes in tumor tissues.

