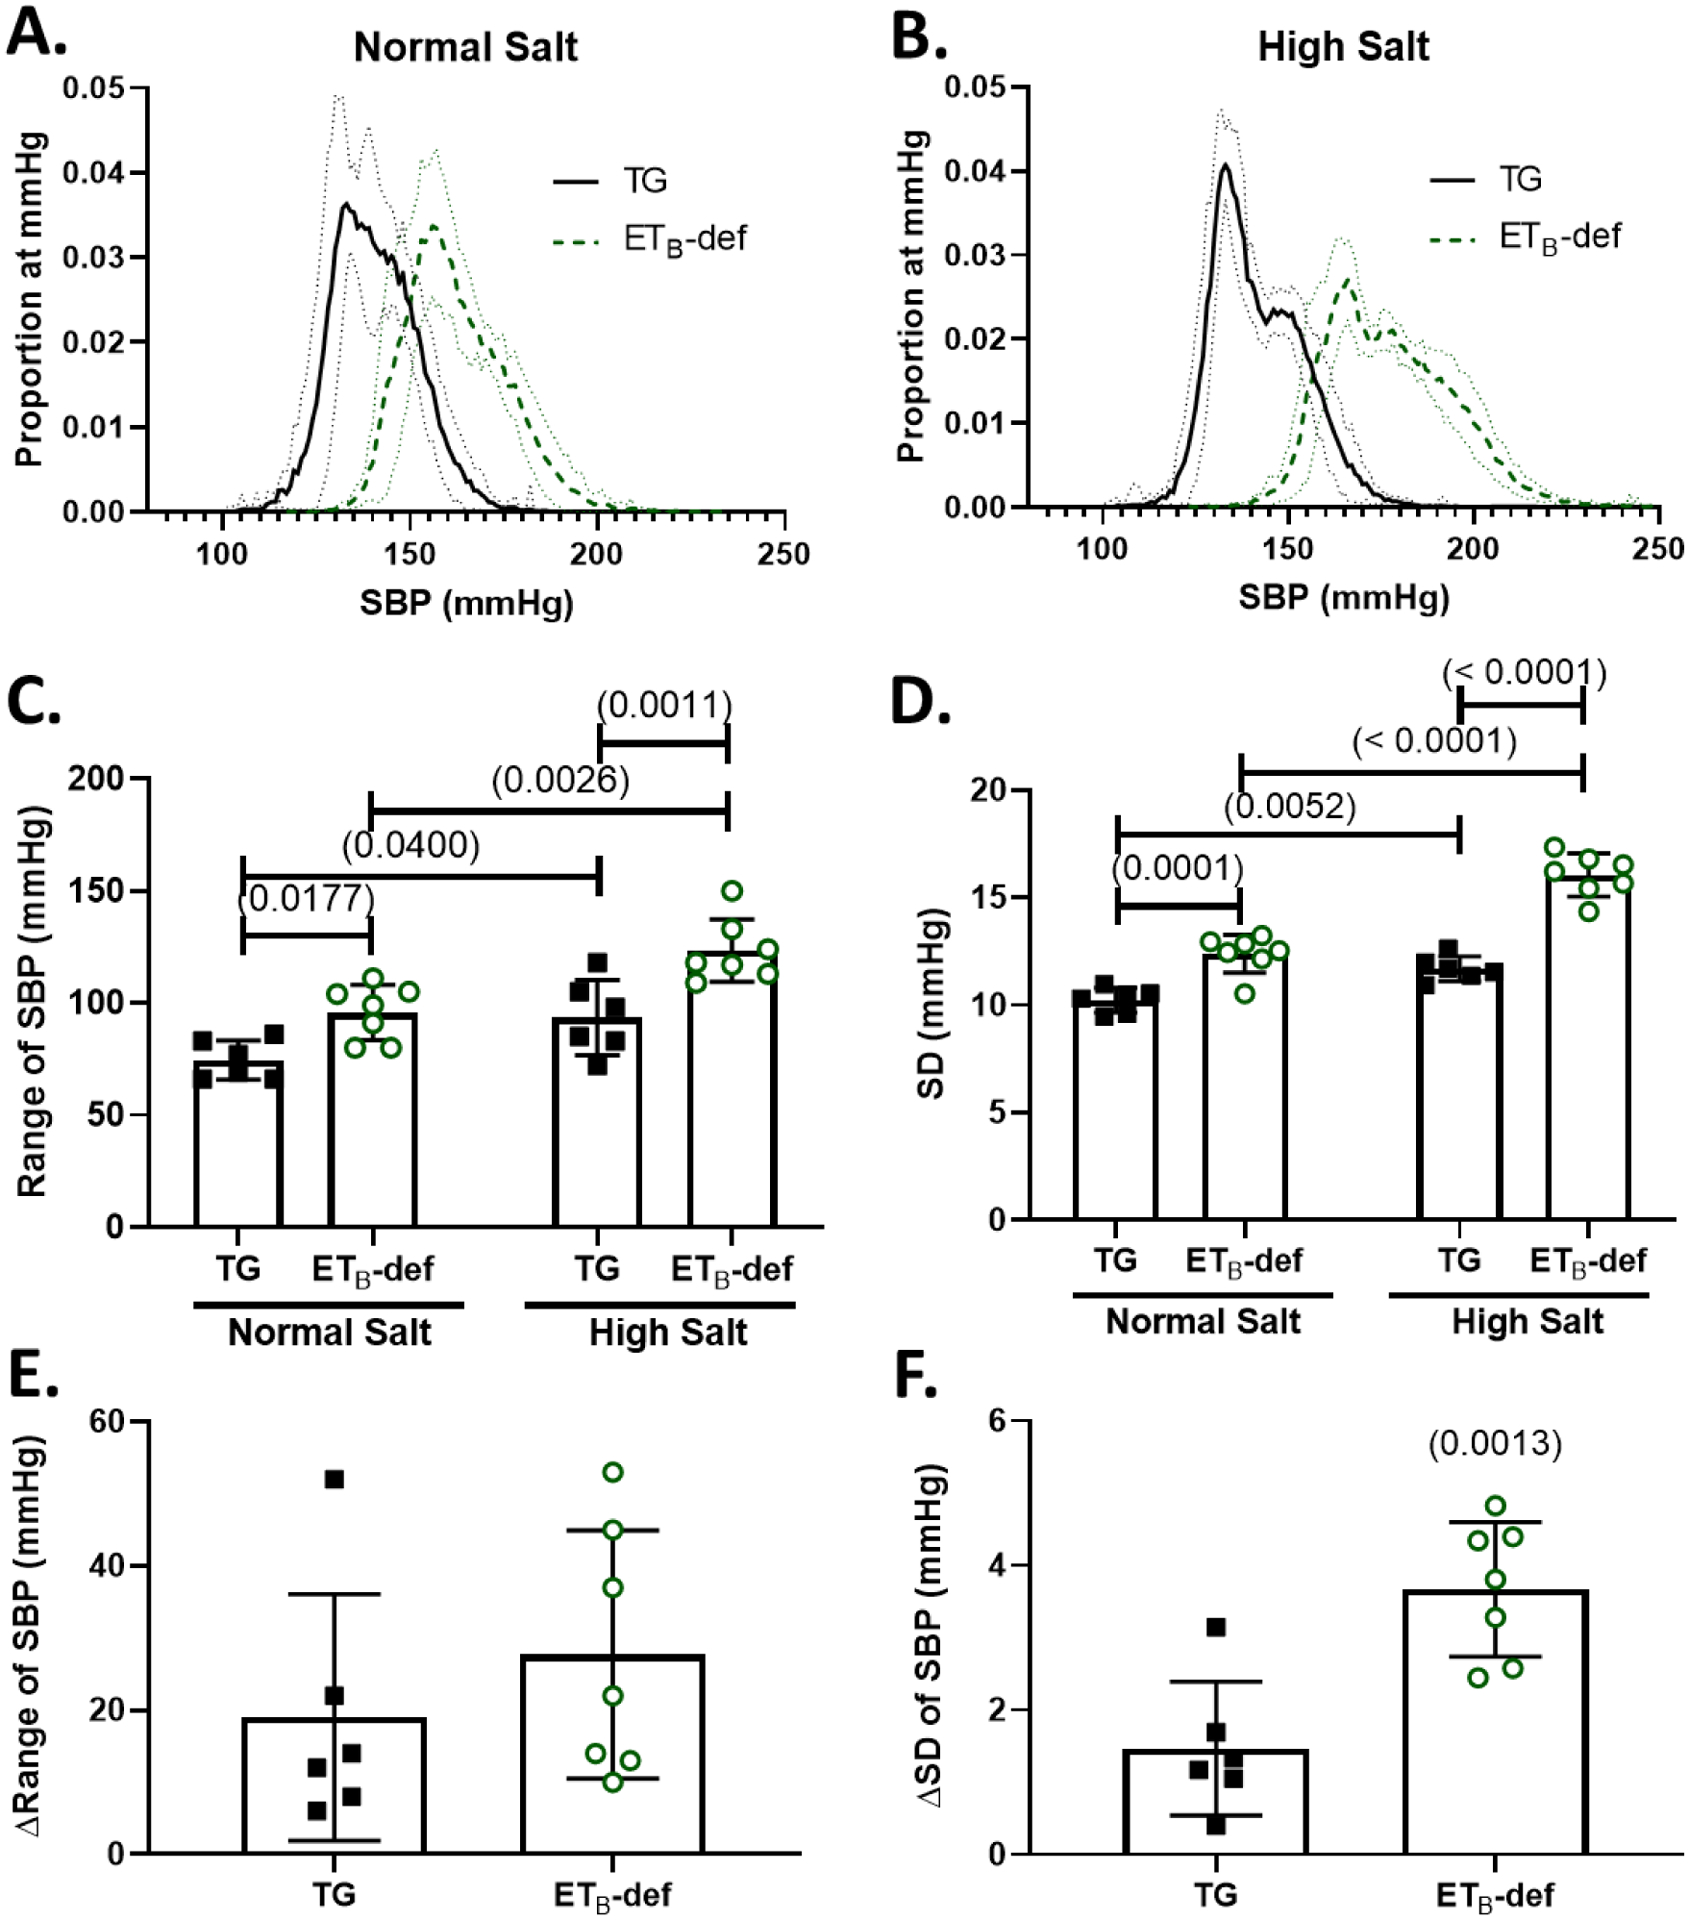
Figure 1: ETB-def rats have elevated blood pressure lability during normal salt and high salt diet.

A/B: frequency distribution plots of proportion of instances at a given SBP (number of instances of 10-second bins at each mmHg / total number of bins) during normal salt diet (A) and 8–11 days of high salt diet (B) Solid line represents mean ± 95% confidence interval. C: Range of SBP during normal and high salt diet, 2-way repeated measures ANOVA Psalt = 0.0005; Pgenotype = 0.0009; Pinteraction = 0.3808, with Sidak’s test for multiple comparisons. D: Standard deviation during normal and high salt diet, 2-way repeated measures ANOVA Psalt < 0.0001; Pgenotype < 0.0001; Pinteraction = 0.0013, with Sidak’s test for multiple comparisons. E: Change in the SBP range between normal salt and high salt diets, unpaired Student’s t-test p = 0.3808, F: Change in the standard deviation of SBP between normal salt and high salt diets, unpaired Student’s t-test, SBP = systolic blood pressure, TG = transgenic, ETB-def = endothelin B deficient, SD = standard deviation.
