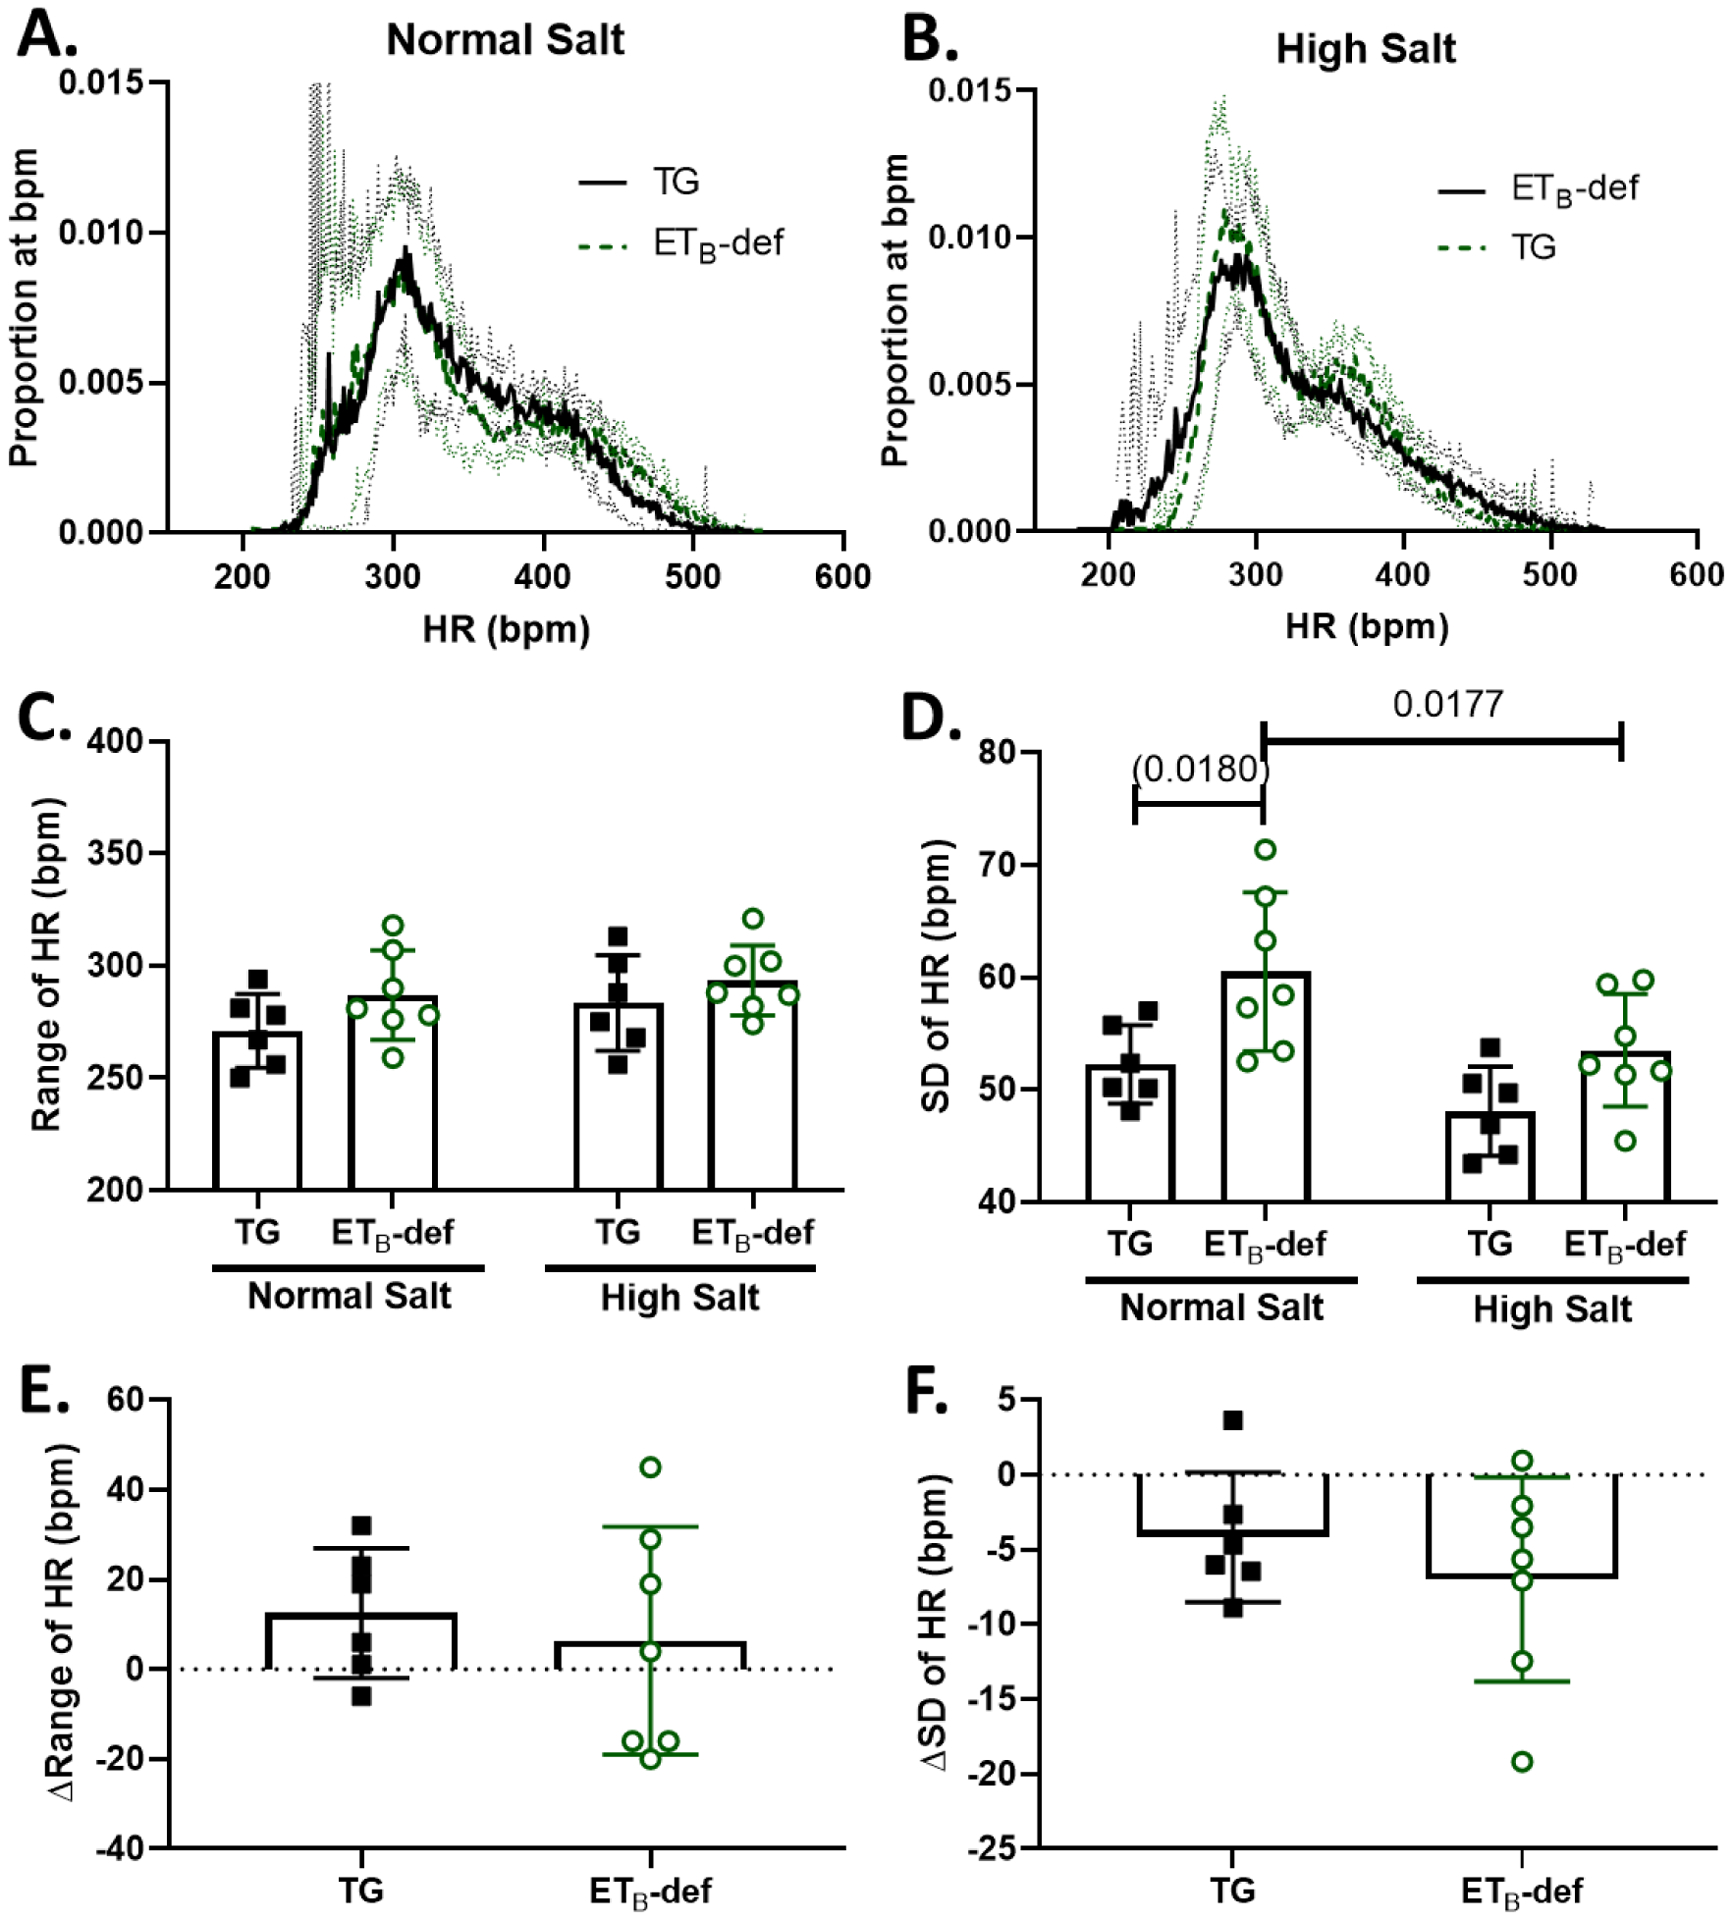
Figure 2: Heart rate lability is similar between TG and ETB-def rats during normal salt and high salt diet.

A/B: frequency distripution plots of proportion of instances at a given HR (number of instances of 10-second bins at each bpm / total number of bins) during normal salt diet (A) and 8–11 days of high salt diet (B) Solid line represents mean ± 95% confidence interval. C: Range of HR during normal and high salt diet, 2-way repeated measures ANOVA, Psalt = 0.1358; Pgenotype = 0.1510; Pinteraction = 0.6159, with Sidak’s test for multiple comparisons (no significant differences). D: Standard deviation of HR during normal and high salt diet, 2-way repeated measures ANOVA, Psalt = 0.0055; Pgenotype = 0.0151; Pinteraction = 0.4046, with Sidak’s test for multiple comparisons. E: Change in the HR range between normal salt and high salt diets, unpaired Student’s t-test p = 0.6159, F: Change in the standard deviation of HR between normal salt and high salt diets, unpaired Student’s t-test p = 0.4046. HR = heart rate, TG = transgenic, ETB-def = endothelin B deficient, SD = standard deviation.
