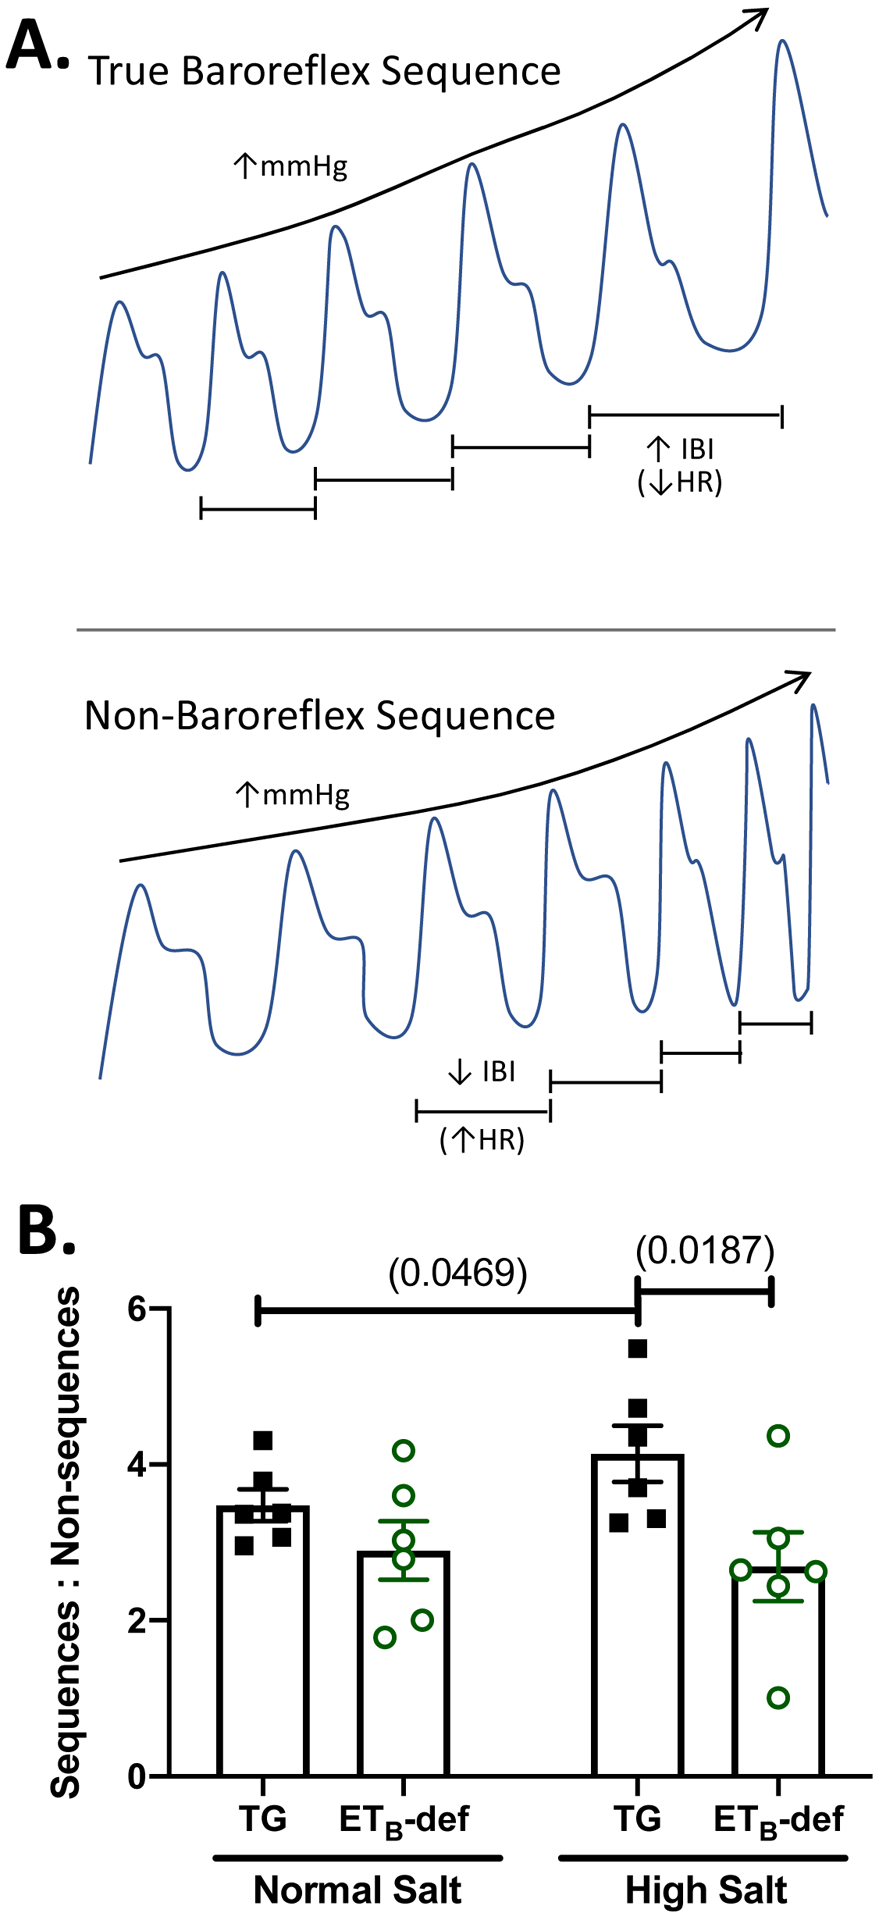
Figure 3: ETB-def rats have fewer true:non-baroreflex sequences following high salt diet.

A: simplified graphical representation of a true baroreflex sequence (top panel: blood pressure and interbeat interval, or IBI, both increasing) vs. a non-baroreflex/feedforward sequence (bottom panel: blood pressure and IBI change in opposite directions). B: ratio of true baroreflex sequences to non-baroreflex sequences in transgenic TG controls and ETB-def rats during normal salt (0.49% NaCl) or on days 8–11 of high salt (4.0% NaCl) diet. 2-way repeated measures ANOVA, Psalt = 0.2233; Pgenotype = 0.0572; Pinteraction = 0.0332 with Sidak’s multiple comparison test. IBI = interbeat interval, HR = heart rate, TG = transgenic, ETB-def = endothelin B deficient.
