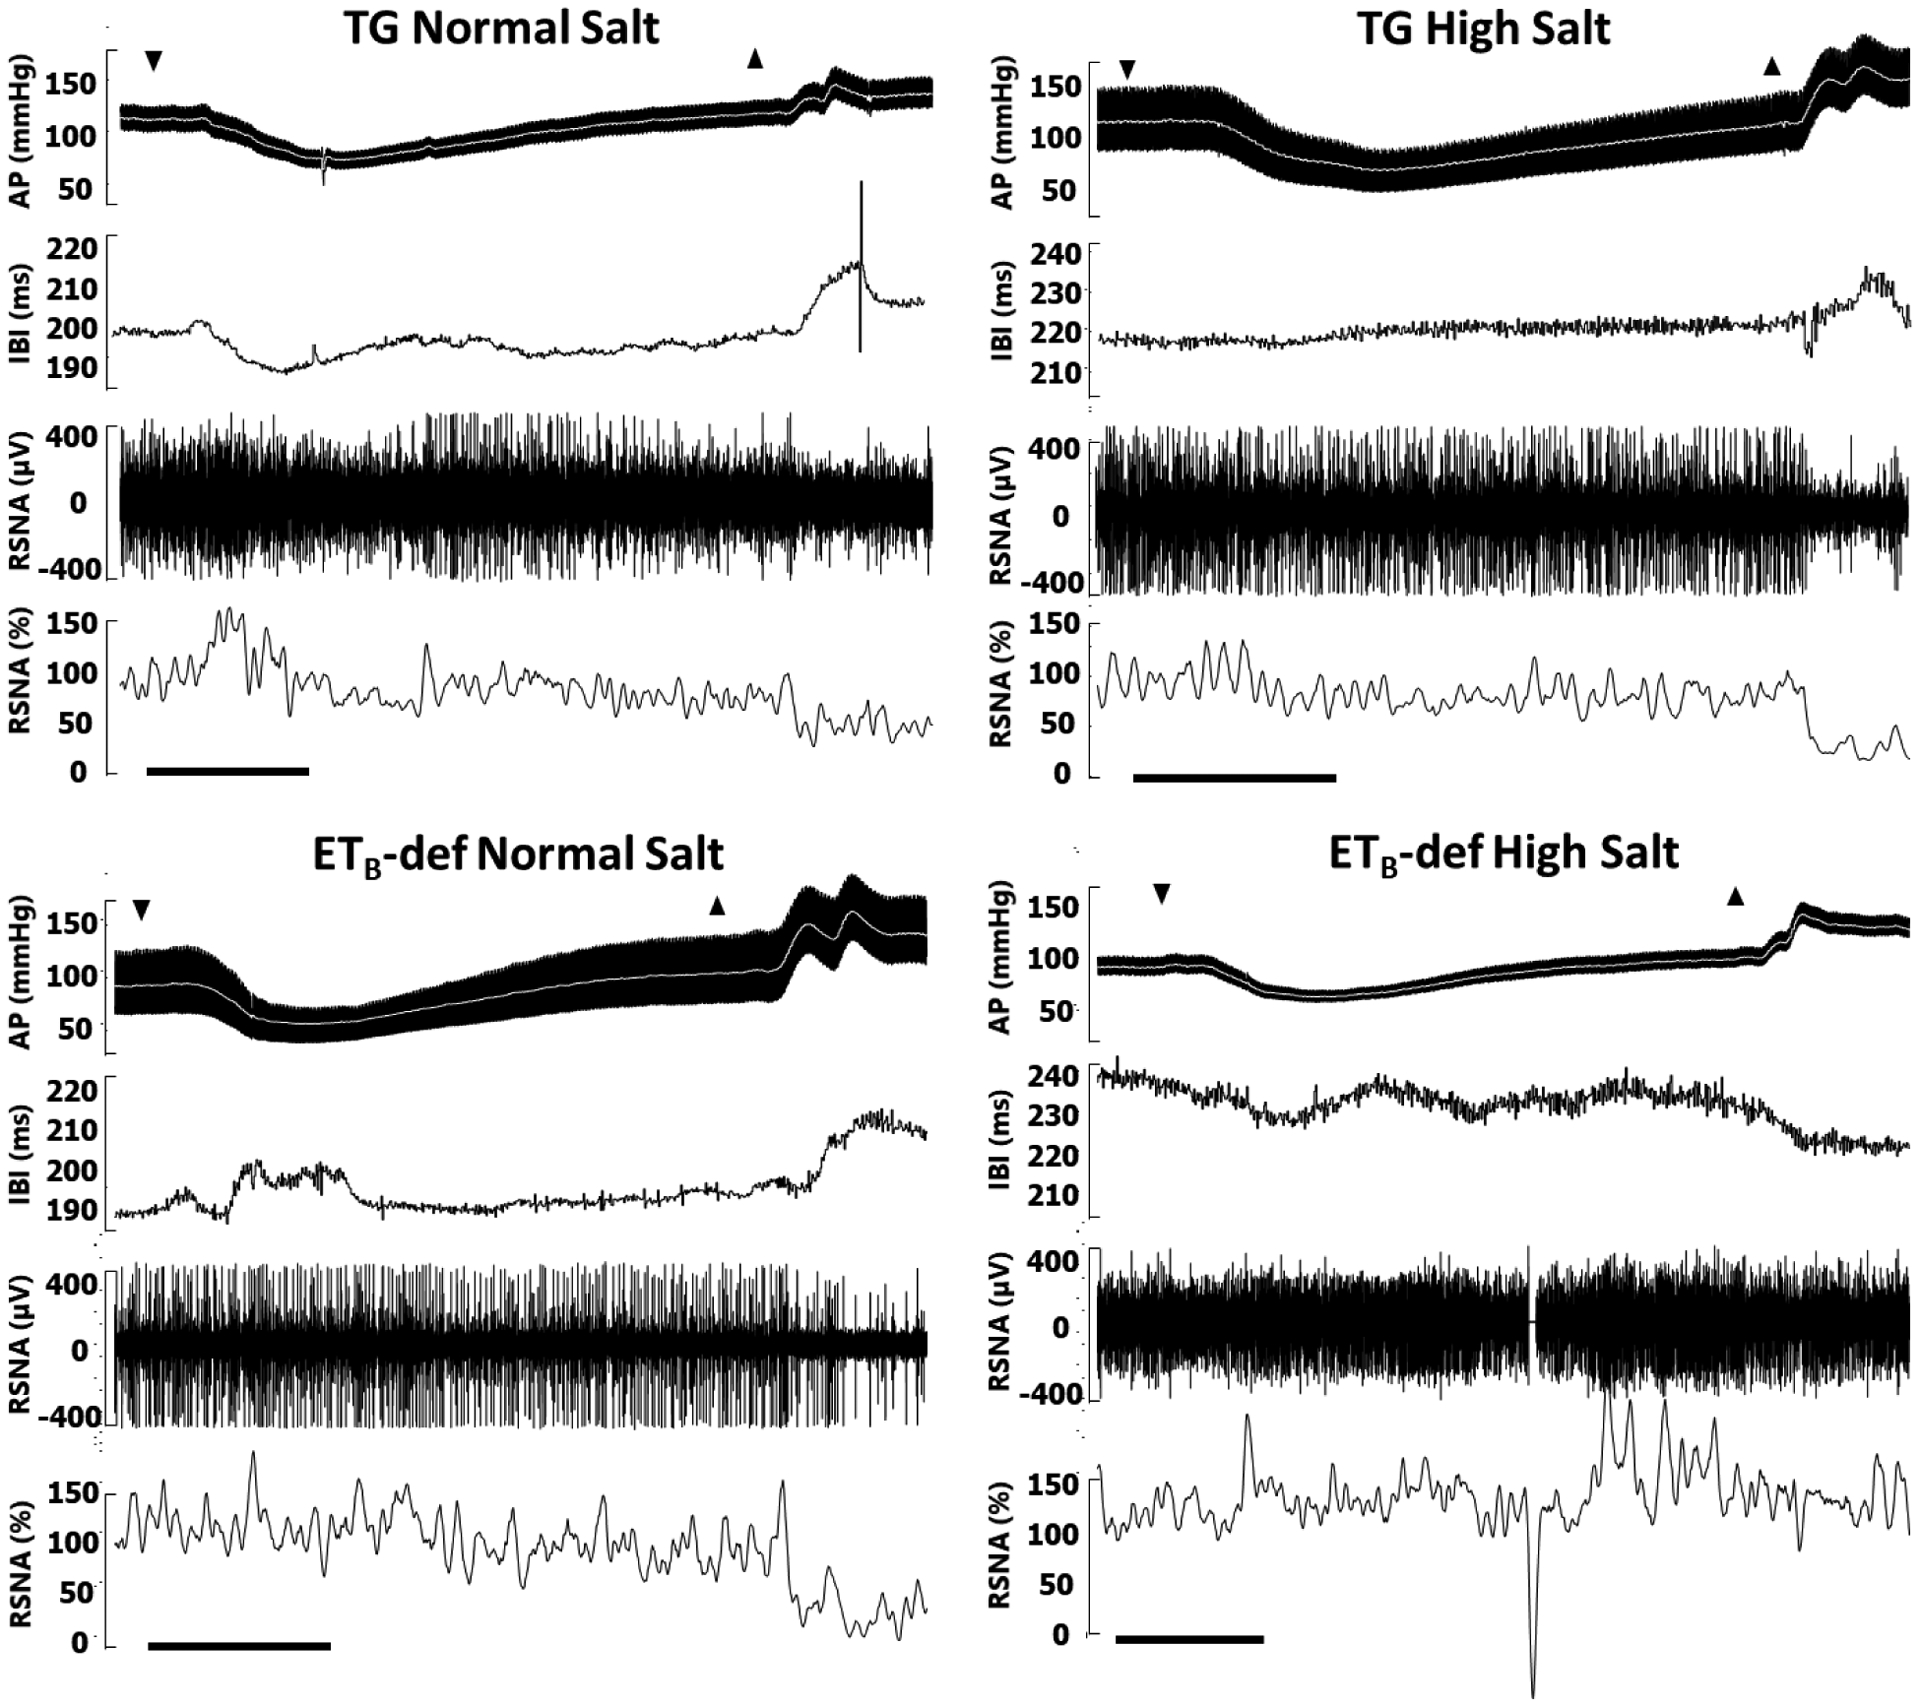
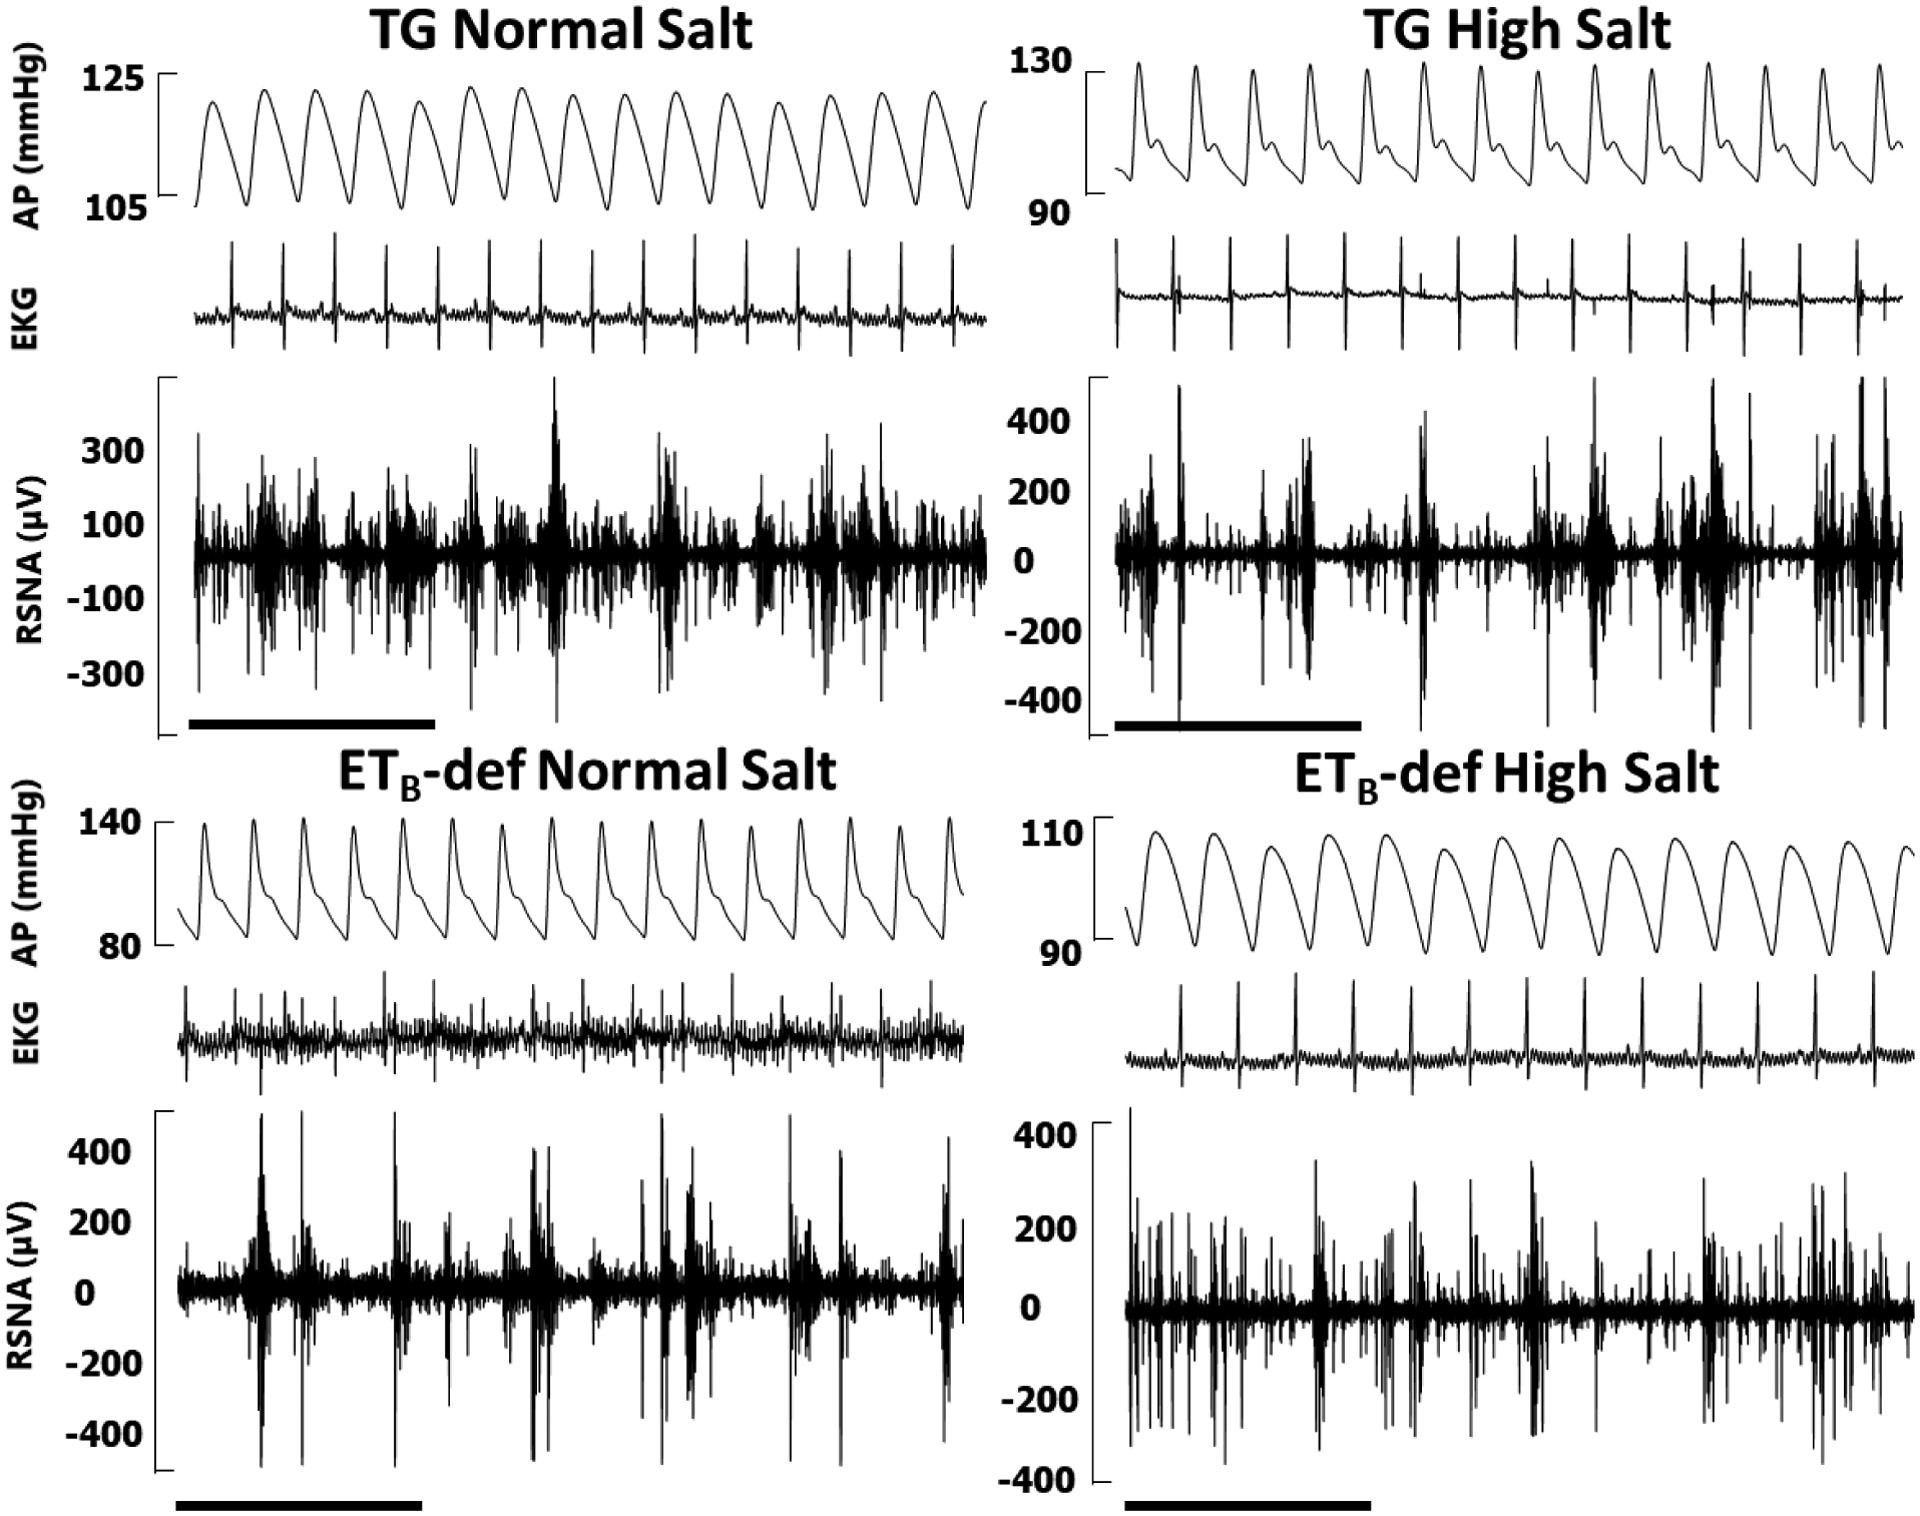
Figure 4: Representative traces of modified Oxford baroreflex experiments.


AP = arterial pressure, mean arterial pressure denoted by white line; IBI = interbeat interval derived from R-R of electrocardiogram (not pictured); RSNA = renal sympathetic nerve activity in raw voltage and as percent of baseline prior to sodium nitroprusside infusion. RSNA percent is smoothed in rolling 2 second intervals for clarity. A: Down arrows denote beginning of bolus infusion of sodium nitroprusside, up arrows denote beginning of bolus infustion of phenylephrine. Scale bars denote 30 seconds. B: Representative baseline segment from each of the four groups demonstrating signal fidelity, EKG, and pulse wave synchronicity of RSNA. Scale bars denote 1 second.
