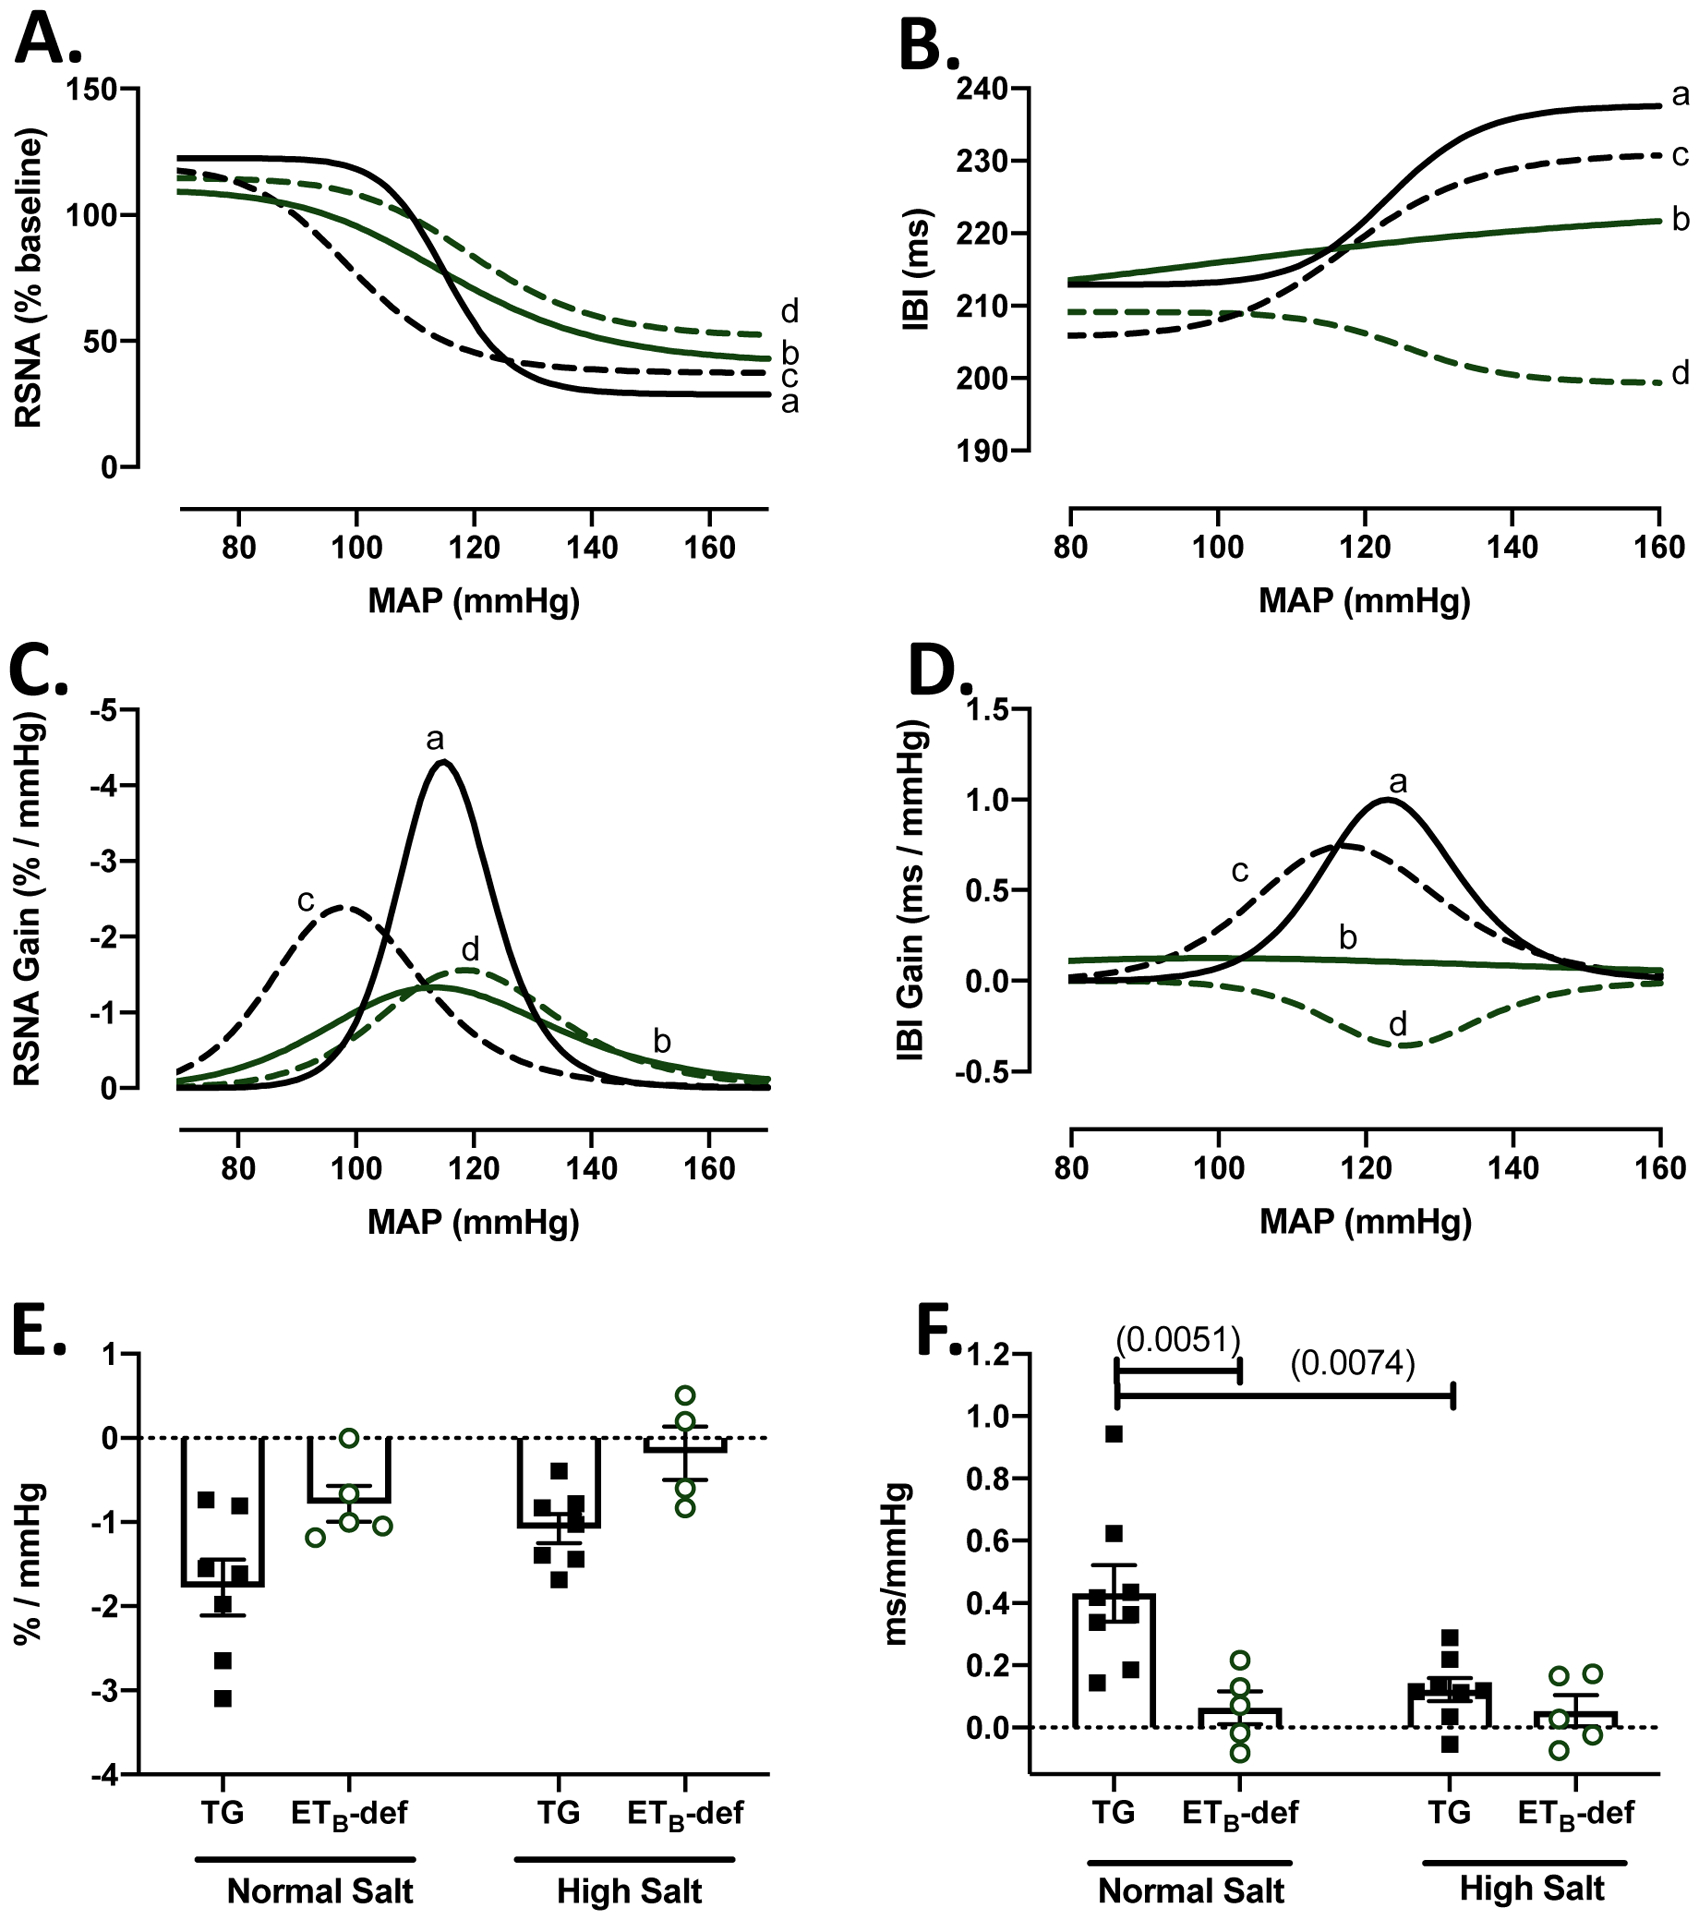
Figure 5: Heart rate baroreflex function is impaired in ETB-def rats compared to TG controls.

A: RSNA composite baroreflex curves. B: heart rate composite baroreflex curves. C: RSNA composite gain curves from first derivative of baroreflex curve. D. heart rate composite gain curves from first derivative of baroreflex curve. (A-D) a = TG NS; b = ETB-def NS; c = TG HS; d = ETB-def HS E. Linear regression of RSNA response to increase in pressure during phenylephrine, 2-way ANOVA Psalt = 0.0309; Pgenotype = 0.0030; Pinteraction = 0.8601, with Sidak’s test for multiple comparisons (no significant differences). F. Linear regression of heart rate response to increase in pressure during phenylephrine, 2-way ANOVA Psalt = 0.0298; Pgenotype = 0.0044; Pinteraction = 0.0400, with Sidak’s test for multiple comparisons. p values in (). RSNA = renal sympathetic nerve activity, MAP = mean arterial pressure, IBI = interbeat interval.
