
Figure 6: Blood pressure increases and lability decreases in Sprague-Dawley rats after ETB receptor antagonism.
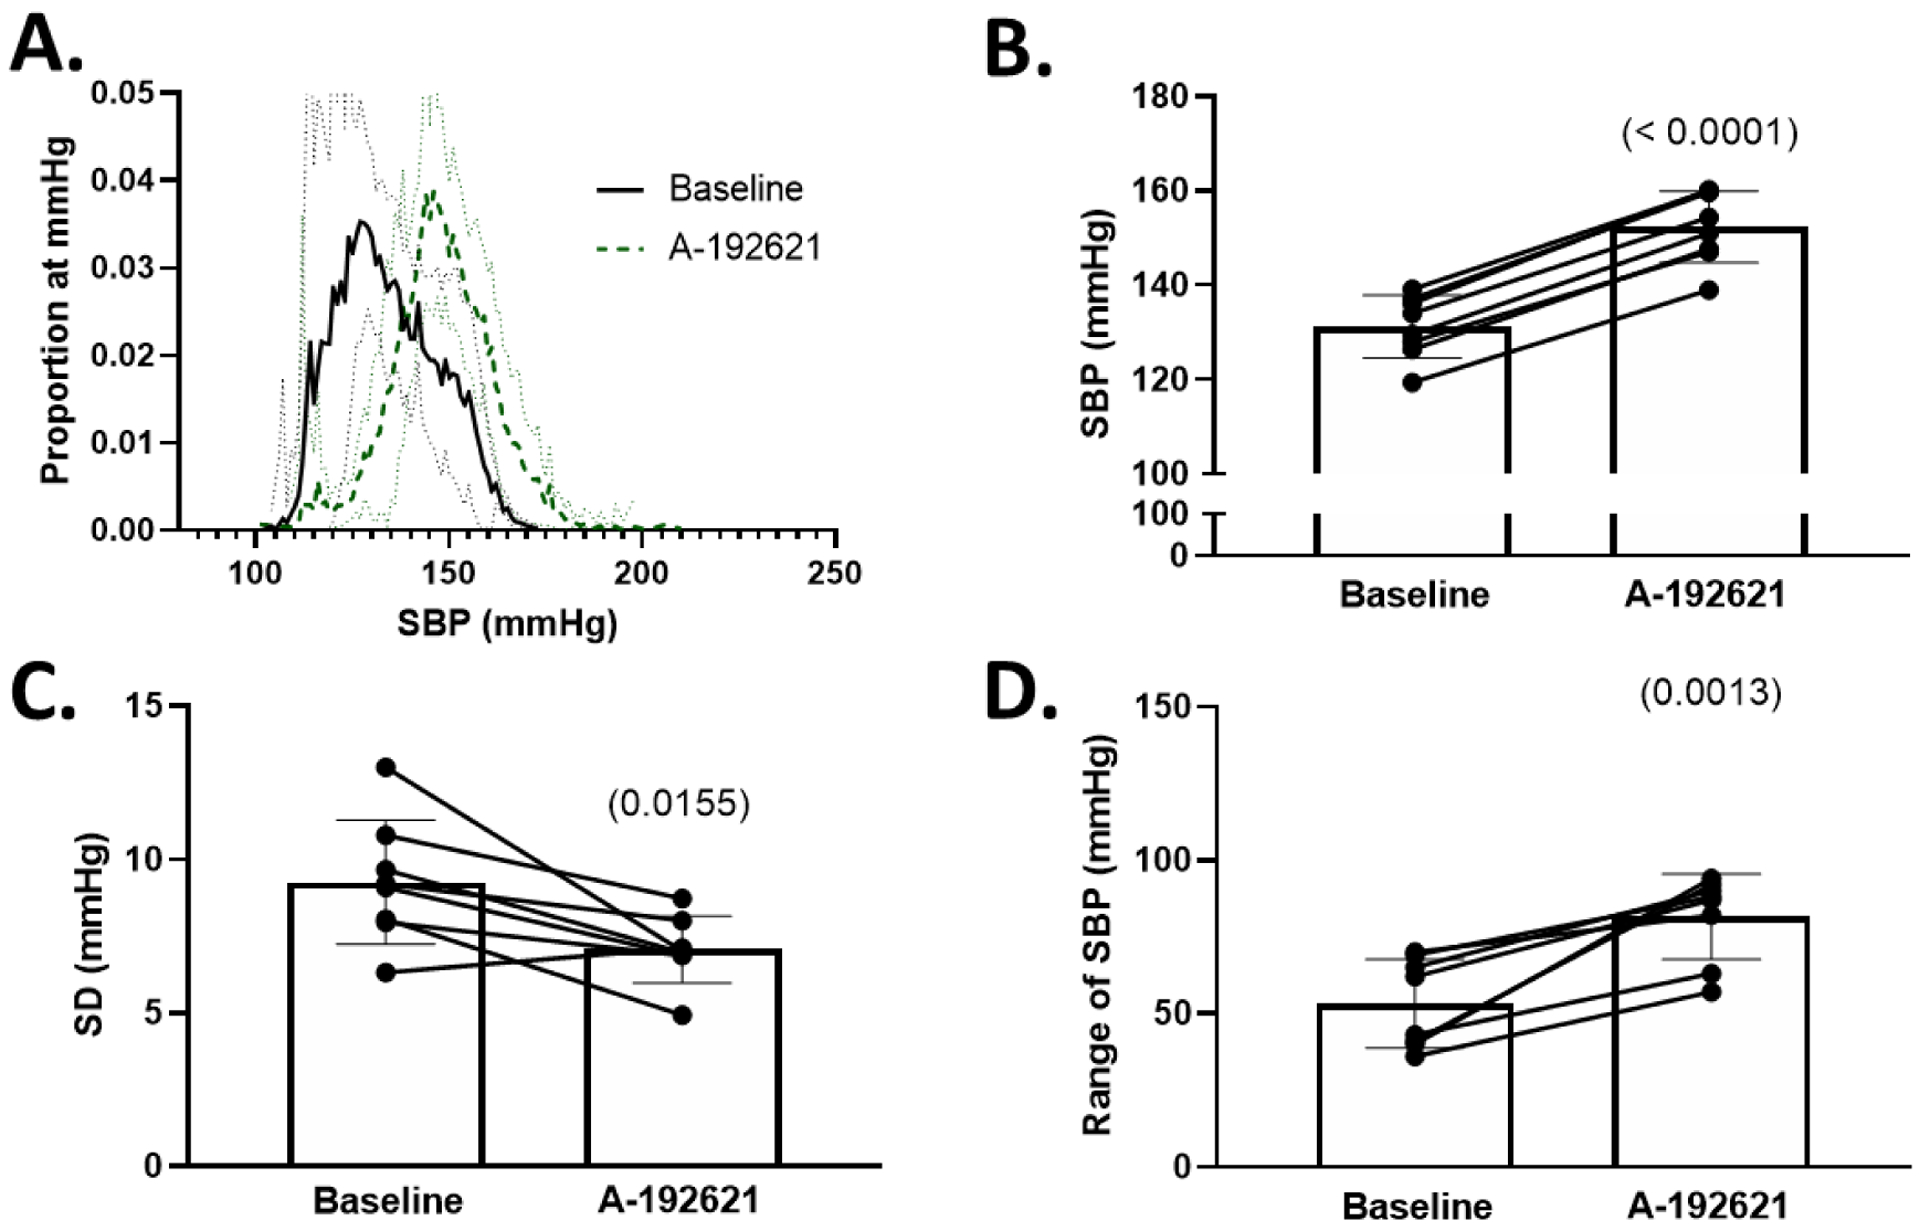
A. Histograms of proportion of instances at a given SBP (number of instances of 10-second bins at each mmHg / total number of bins) during baseline and following 3–5 days of selective endothelin B antagonism with A-192621. Solid line represents mean ± 95% confidence interval B. 24-hour average SBP at baseline and following A-192621. C. Standard deviation (SD) of SBP before and after A-192621. D. Range of SBP before and after A-192621. All comparisons made using paired Student’s t-test, p values in (). SBP = systolic blood pressure.