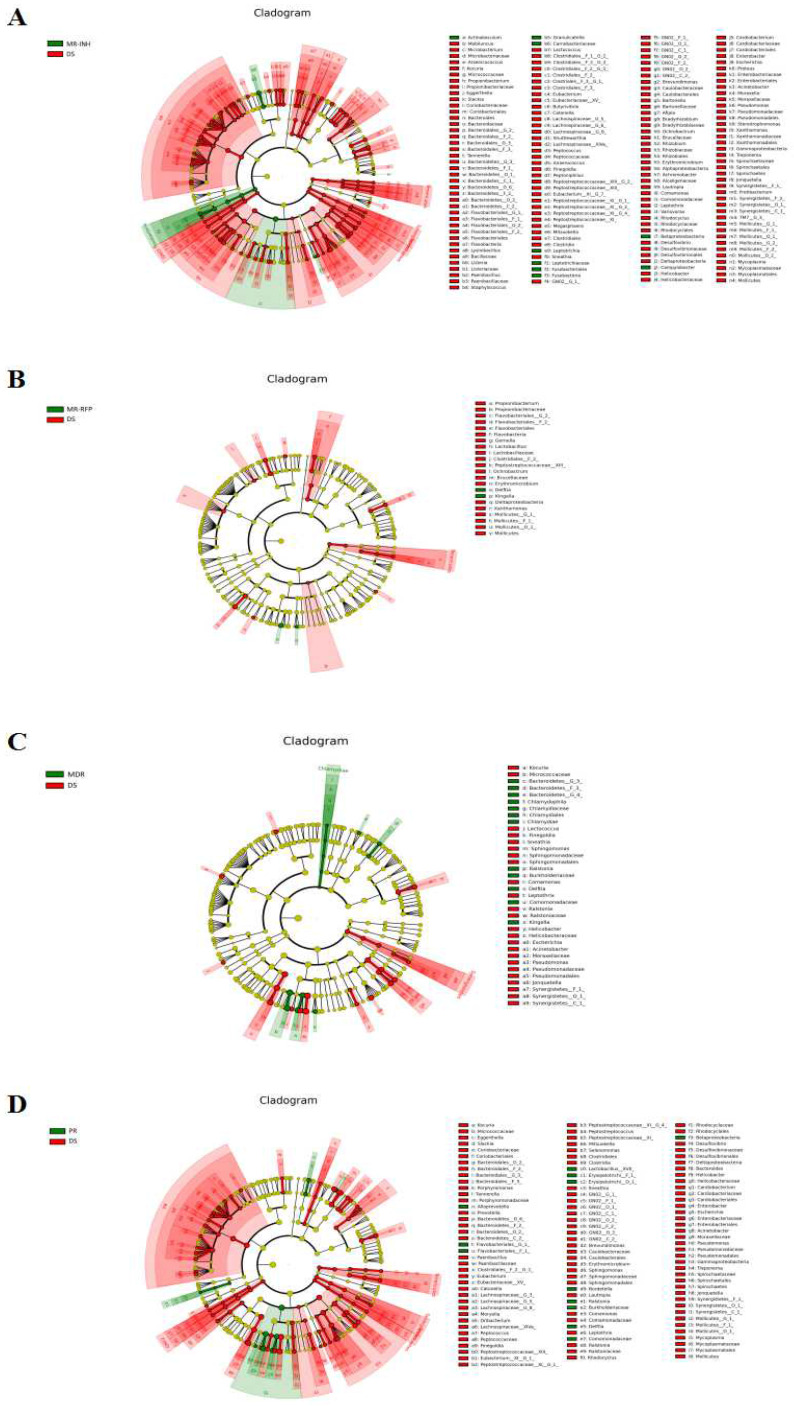
Figure 4.
LEfSe analysis of sputum flora differences between samples. (A) Differential display of flora in MR-INH and DS groups. (B) Differential display of flora in MR-RFP and DS groups. (C) Differential display of flora in MDR and DS groups. (D) Differential display of flora in PR and DS groups. The classification level tree displayed by cladogram describes the hierarchical relationship of all the flora from phylum to genus (successively ordered from the inner circle to the outer circle) in the sample community. The node size corresponds to the average relative abundance of the flora, red and green respectively indicate flora with high abundance, and the difference is significant. The letters make the names of the flora with significant differences between the groups.

