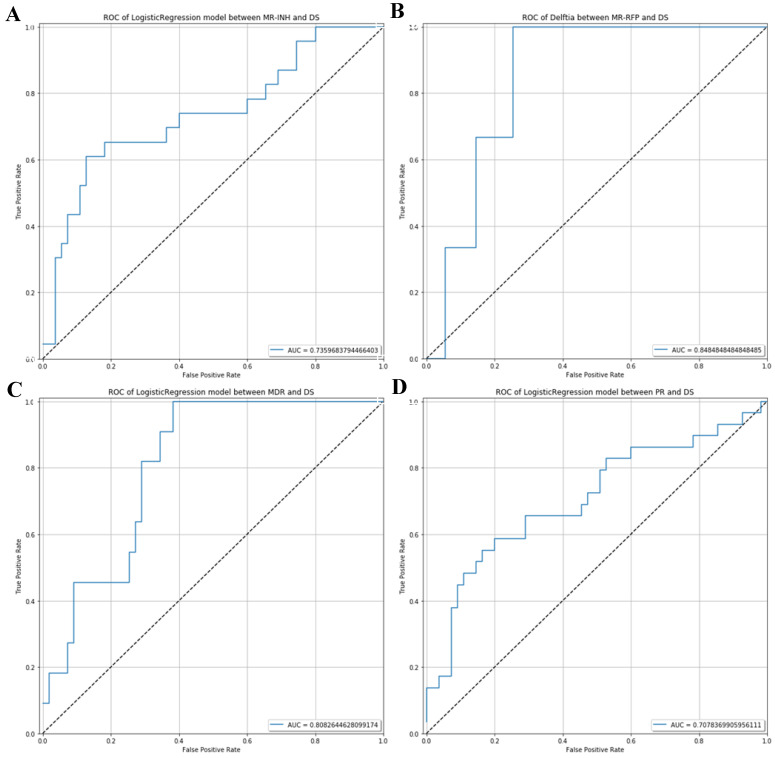
Figure 5.
ROC analysis which can be used to distinguish potential diagnostic flora of respiratory microecology in the drug-sensitive group and different drug-resistant groups. (A) ROC curve between MR-INH and DS. (B) ROC curve between MR-RFP and DS.(C) ROC curve between MDR and DS. (D) ROC curve between PR and DS.

