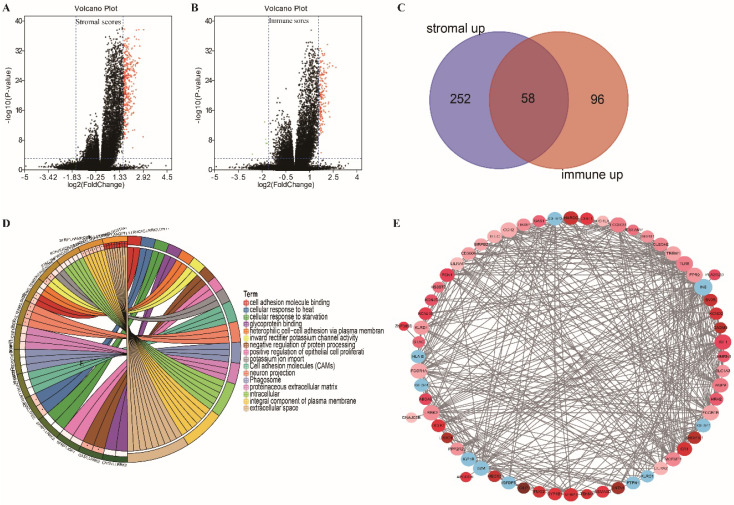
Figure 3.
Volcano plot, Venn plots, circle enrich plot, PPI network. (A-B) Volcano for DEGs generated by comparison of the high score group vs the low score group in Stromal scores and Immune Scores. Differentially expressed genes were determined by Wilcoxon rank sum test with adjust. p-value< 0.001 and fold-change ≥3 after log2transformation as the significance threshold. (C) Venn plots showing common up-regulated and down-regulated DEGs shared by Immune Scores and Stromal Scores. (D) circle enrich plot. GO and KEGG enrichment analysis for 58 DEGs, terms with p and q < 0.05 were believed to be enriched significantly. (E) Interaction network constructed with the nodes with interaction confidence value >0.40.

