Figure 6.
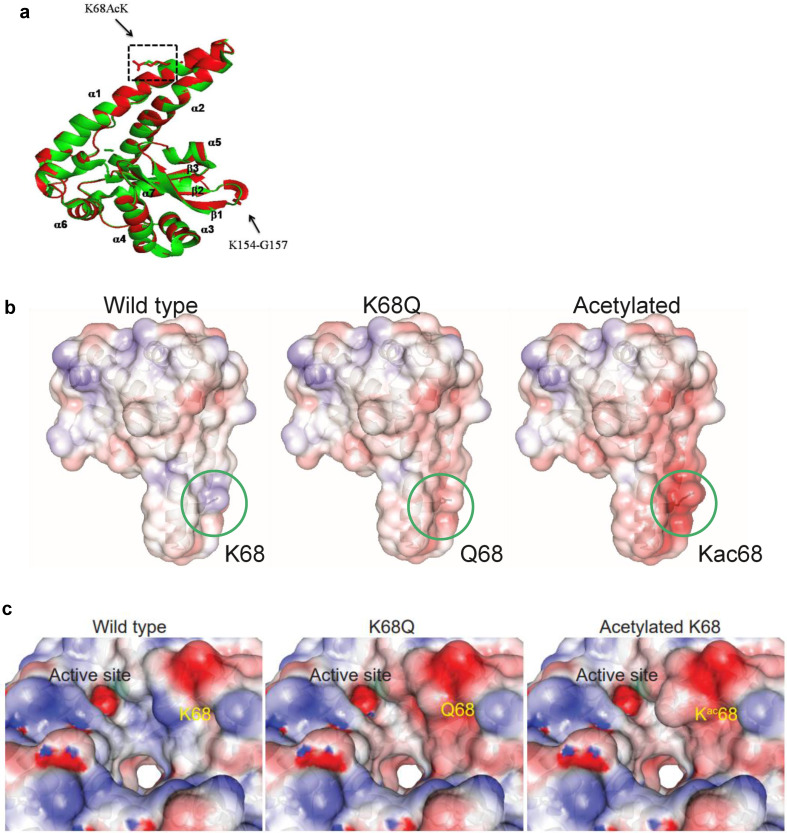
Molecular dynamics of MnSOD upon its acetylation status. (a) The MnSOD-K68 acetylation locates at the α1/α2 helical structure of the MnSOD monomer. (b) Molecular dynamic simulation shows the charge distribution at K68 during its WT state, acetylation state or acetylation mimetic (MnSODK68Q). Blue color indicates positive charge distribution and red color indicates negative charge distribution. (c) A close-up view of the charge distribution and structural change around MnSOD-K68 is displayed. The green ball indicates the Mn2+ location.

