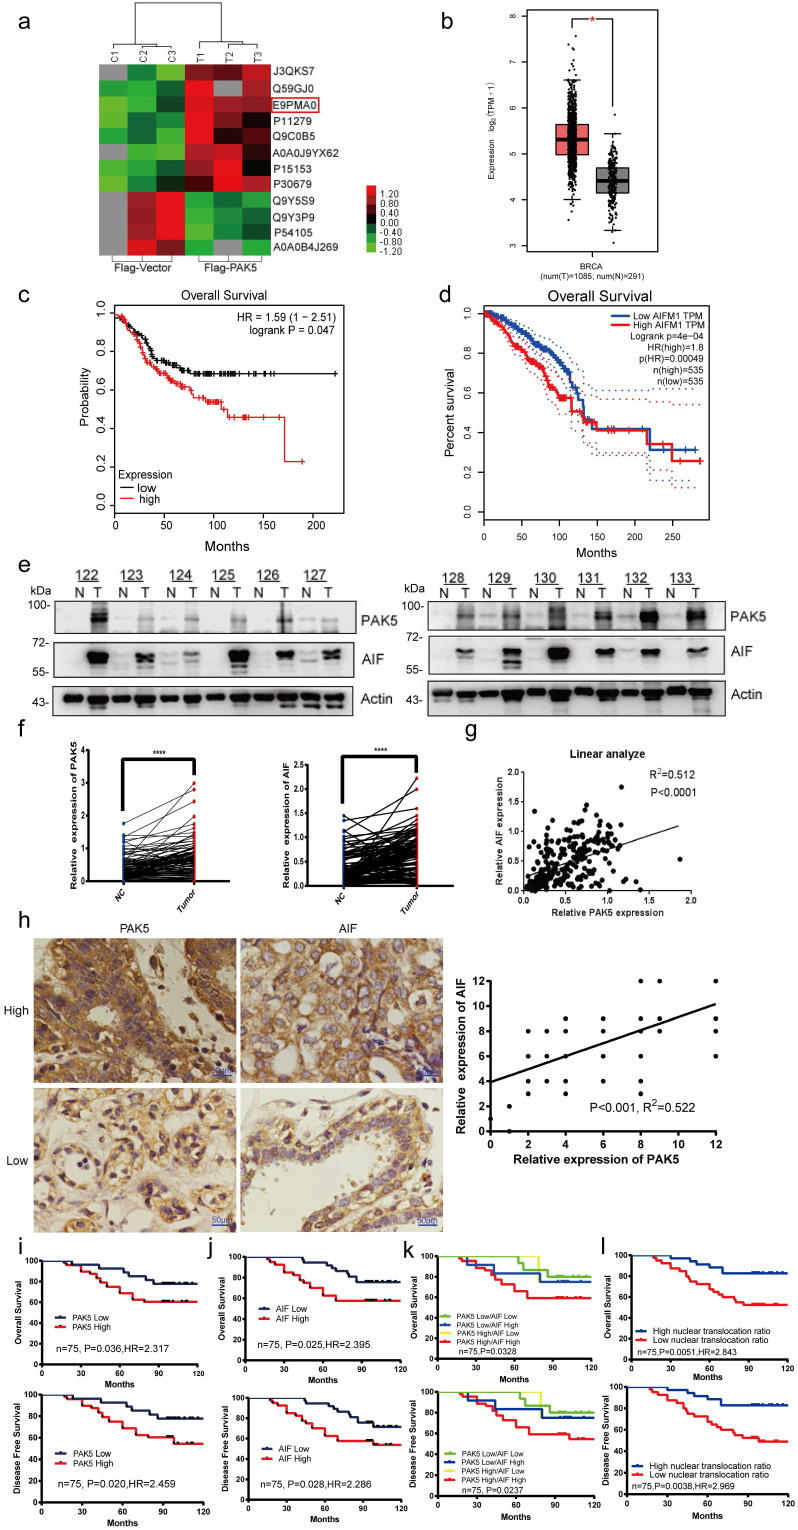
Figure 1.
PAK5 and AIF expression positively correlated with poor prognosis of breast cancer. (a) Analysis of expression differential proteins regulated by PAK5. Lysates from MDA-MB-231 cells overexpressing Flag-vector or Flag-tagged PAK5 and screening of differentially expressed proteins by sequencing. (b) Predict the expression of AIF in breast cancer and adjacent cancer in TCGA database. The fold-change was 0.897. (c) Predict the overall survival of AIF in GSE31519 database. (d) Predict the overall survival of AIF in TCGA database. (e) PAK5 and AIF expression in 122 clinical breast tissue pairs. Lysates of tumor tissues (T) and matched adjacent noncancerous tissues (N) were analyzed using Western blotting. Twelve representative pairs are shown. (f) The indicated protein levels in (e) were statistically analyzed (****p < 0.001). (g) Spearman's rank test was used to analyze the correlation between AIF relative expression and PAK5 relative expression in 122 subjects. (h) Representative images of immunohistochemical staining showing PAK5 and AIF protein expression in breast cancer. Original magnification, 400×. IHC staining was scored, and a Pearson correlation test was performed. Note that the scores of some samples overlap. (i-l) Kaplan-Meier survival analysis (GraphPad) of the relationship between overall survival (upper) and disease-free survival (lower) in breast cancer cases and PAK5 and/or AIF expression. The subjects were divided into different groups based on the indicated PAK5 and AIF expression scores in the tumors: PAK5 low (n = 35) and PAK5 high (n = 40, i); AIF low (n = 36) and AIF high (n = 39, j). n = 15 for PAK5 low/AIF low, n=4 for PAK5 high/AIF low, n=12 for PAK5 low/AIF high, n = 44 for PAK5 high/AIF high; n = 35 for high nuclear translocation ratio of AIF, n = 40 for low nuclear translocation ratio of AIF.

