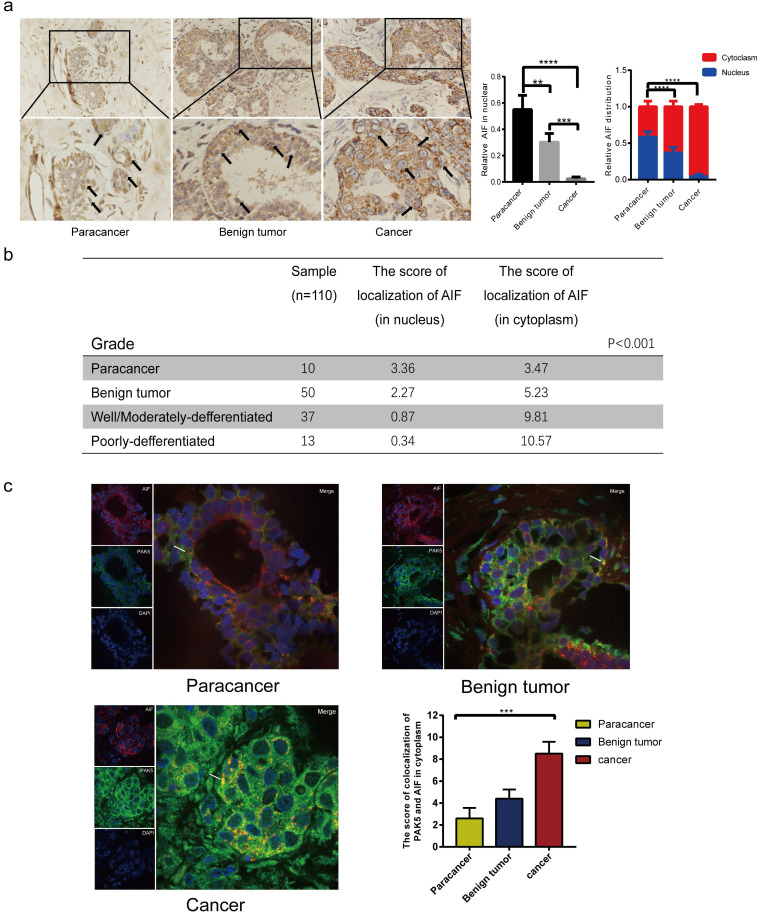
Figure 6.
Expression levels of AIF in nucleus and cytoplasm reveal the clinical relevance between PAK5 and AIF nuclear translocation in breast cancer. (a) AIF expression was detected by immunohistochemical (IHC) staining. 10 cases of Para cancer, 50 cases of breast benign tumor and 50 cases of breast cancer were collected for immunohistochemical analysis. The percentage of AIF in total visual field cells with nuclear translocation and the percentage of AIF in nucleus or cytoplasm of cells with nuclear translocation were calculated from 10 independent visual fields (**P < 0.01, ***P < 0.001, ****P < 0.0001). (b) The nuclear translocation of AIF was negatively correlated with the malignant degree of tumor. The localization fraction of AIF in the nucleus was calculated and determined according to the intensity of staining cells (0-3) and the number of stained cells (0-4). The total score (0-12) was obtained. The black arrow in the figure indicates that the expression of AIF in the nucleus (***P < 0.001). (c) 10 cases of normal breast tissue, 10 cases of benign breast tumor, 10 cases of breast cancer were collected for immunofluorescence analysis. The specimens were fixed and incubated with anti PAK5 antibody (green), anti AIF antibody (red). The nuclei were stained with DAPI (blue). The co localization of PAK5 and AIF in the cytoplasm was calculated from 10 independent visual fields, and was determined according to the intensity of staining cells (0-3) and the percentage of stained cells (0-4). The total score (0-12) is obtained by multiplying the dyeing intensity with the fraction. The white arrow in the figure indicates that AIF and PAK5 are co-located in the cytoplasm (***P < 0.001).

