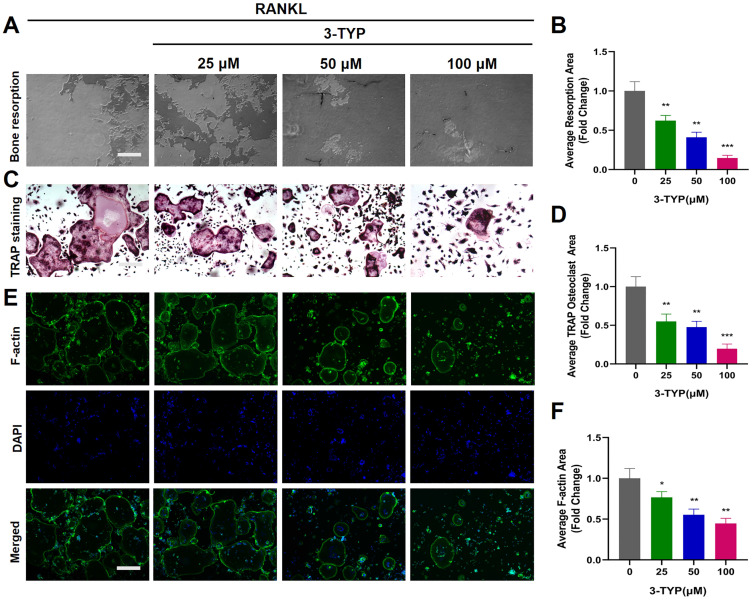
Figures 2.
Inhibition of SIRT3 suppresses F-actin ring formation and bone resorption. (A) Resorption pits were assessed via inverted microscope. (B) Image J was used to measure pit area values. (C) TRAP staining was used to analyze osteoclasts differentiation (D) TRAP positive cells are quantified. (E) Osteoclasts were stained for F-actin (green) and nuclei (blue). (F) Quantification of the F-actin ring number per well. Scale bar: 100 µm. Data are means ± SD (* p<0.05, ** p<0.01, ***p<0.005, n=3).

